Markel Group Inc. MKL
Revenue Intelligence Report • 66 quarters of SEC filing data • Updated 2026-03-15
Revenue is forecast to decline about 5% year over year, reflecting near-term headwinds, even as the business continues to benefit from platform-scale growth and pricing power over the longer run. Binding constraint: underwriting capacity and the capital to support higher underwriting volumes appear to be the primary limiter on revenue growth; incremental SG&A spend is not the growth lever. In our econometric model, structural/platform growth accounts for roughly 95% of the revenue movement, with SG&A contributing about 5% and R&D essentially zero. Key risk: a material tightening of capital or underwriting capacity, or an adverse claims cycle, could cap growth even if the platform remains strong.
Investment Thesis
At 19.4% MAPE, the model captures Markel Group Inc.'s broad revenue trajectory, though quarterly variability suggests sensitivity to external factors. Sales & marketing spend shows a 0.96x elasticity, suggesting effective go-to-market execution.
Revenue Forecast
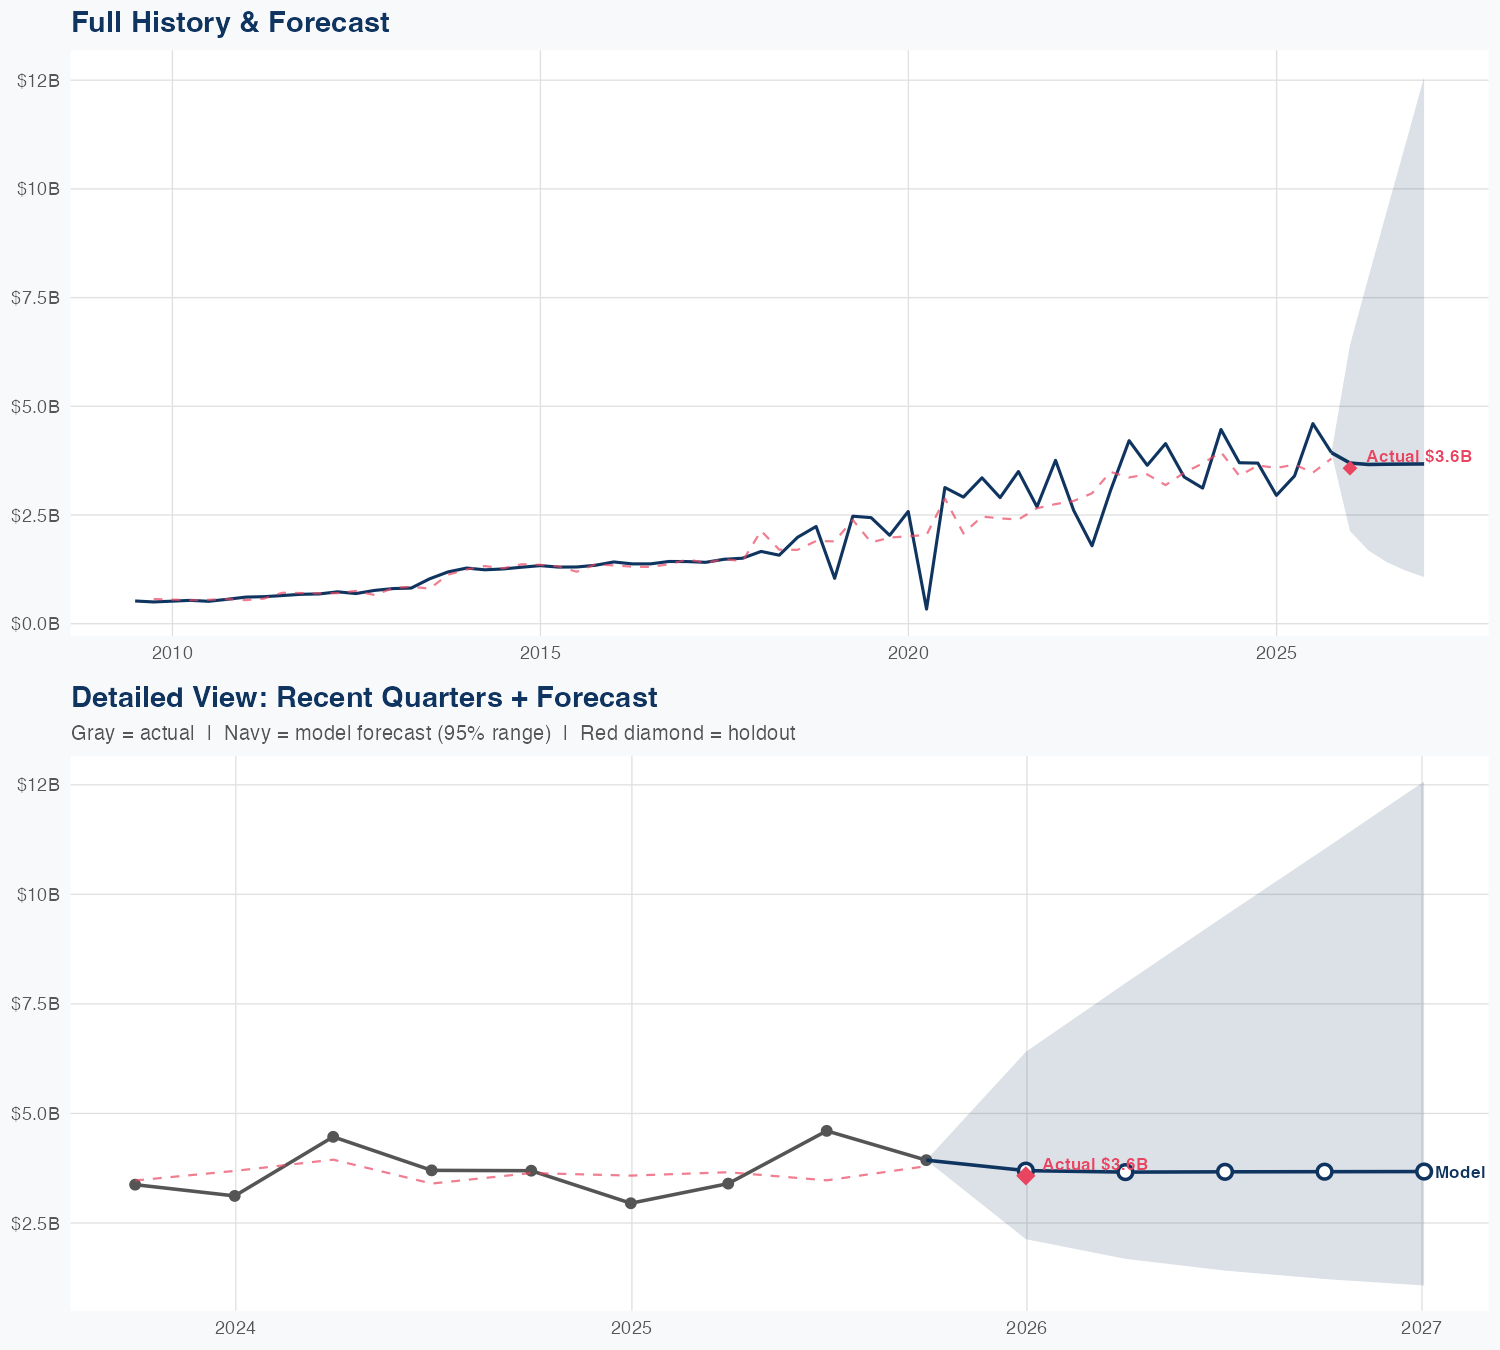
Quarterly Detail
| Quarter | Model Forecast | Actual | 95% Range | YoY Growth | Status |
|---|---|---|---|---|---|
| Q4 2025 | $3.7B | $3.6B | $2.1B – $6.4B | +25.2% | ✓ In range |
| Q2 2026 | $3.6B | $1.7B – $7.8B | +5.8% | ||
| Q3 2026 | $3.5B | $1.3B – $9.0B | -24.7% | ||
| Q4 2026 | $3.9B | $1.3B – $12B | -0.6% | ||
| Q1 2027 | $3.7B | $1.1B – $13B | +3.8% |
Seasonal Factors
| Fiscal Quarter | Seasonal Factor | vs Trend | Interpretation | Obs. |
|---|---|---|---|---|
| FQ1 (Sep–Nov) | 1.0148 | +1.5% | In line with trend | 17 |
| FQ2 (Dec–Feb) | 0.9874 | -1.3% | In line with trend | 16 |
| FQ3 (Mar–May) | 1.0069 | +0.7% | In line with trend | 16 |
| FQ4 (Jun–Aug) | 1.0886 | +8.9% | +8.9% above trend | 16 |
How Spending Drives Revenue
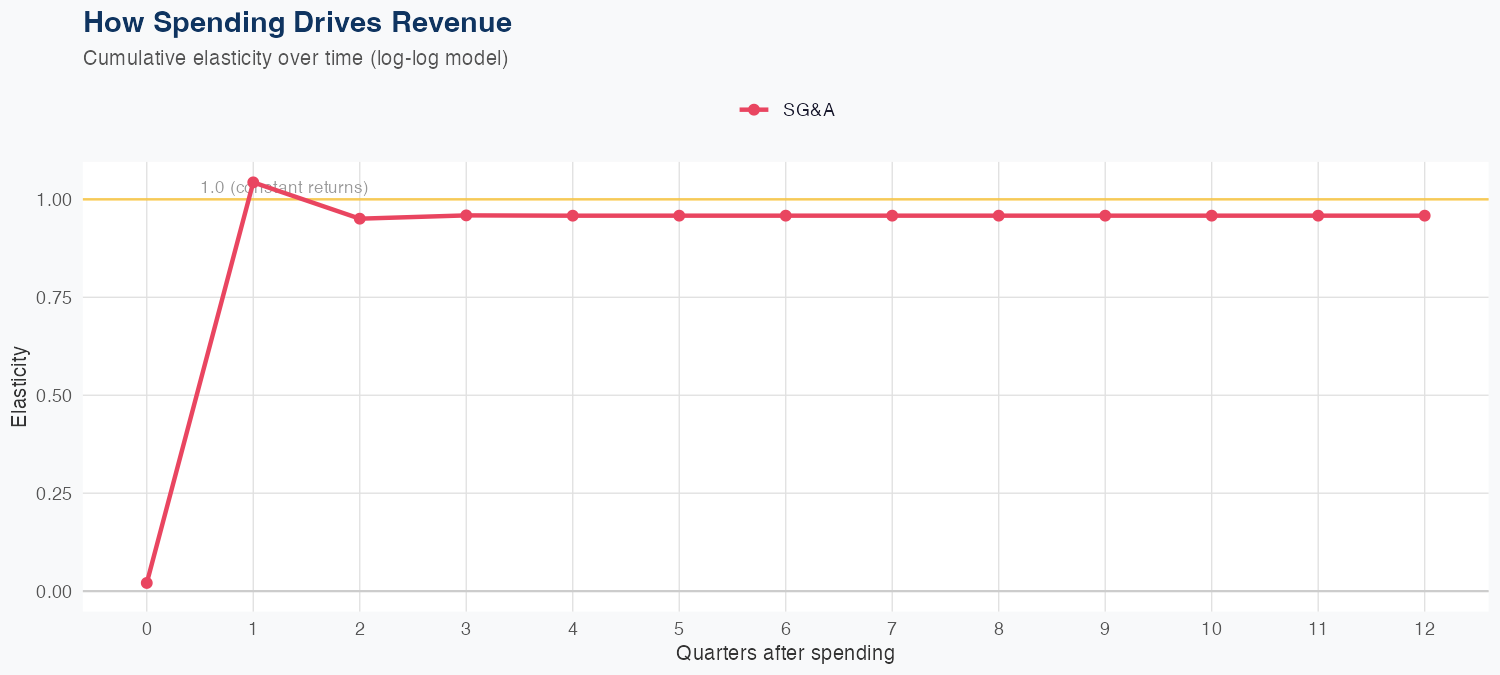
Spending Efficiency Over Time
Current SG&A elasticity: 0.0086x
Want this analysis for your portfolio?
I build custom revenue intelligence reports for investors and companies using SEC filing data, econometric modeling, and AI-powered insights.
Get in Touch