Moderna, Inc. MRNA
Revenue Intelligence Report • 32 quarters of SEC filing data • Updated 2026-03-15
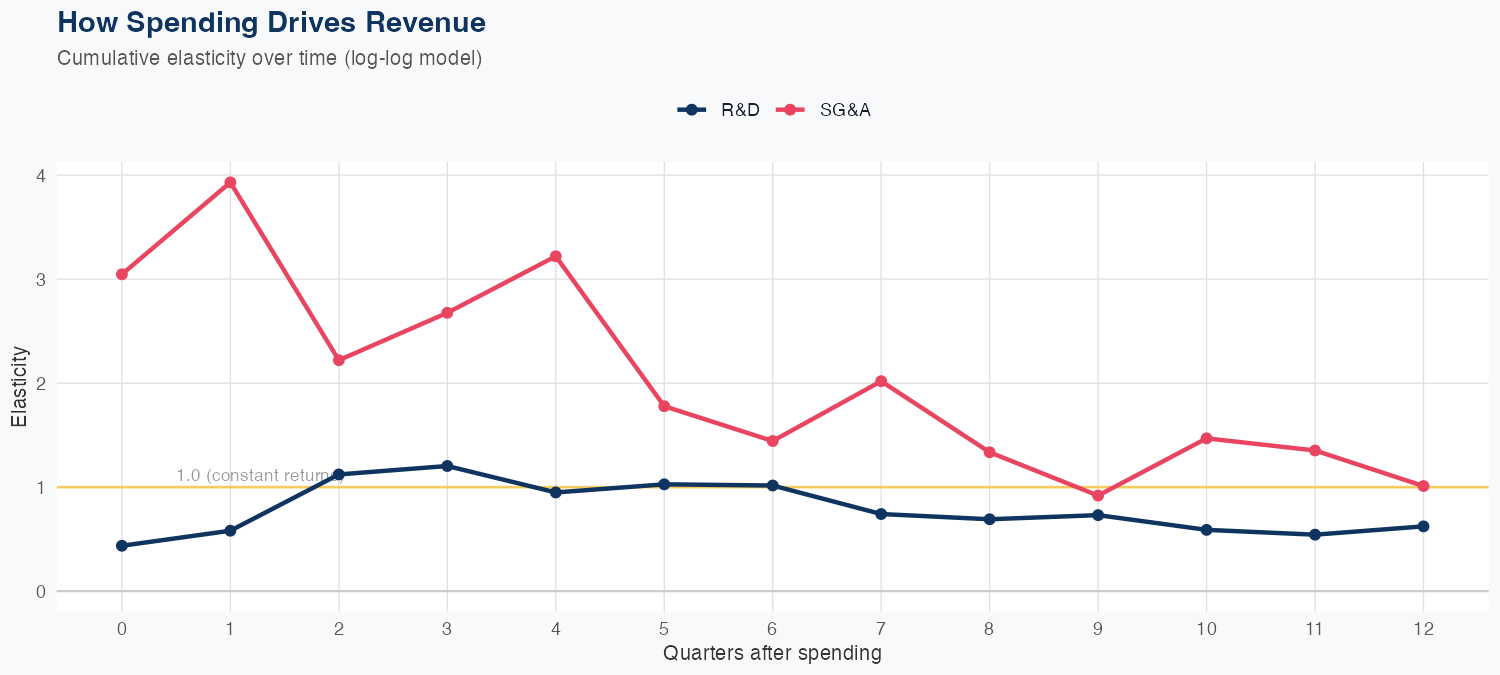
Revenue growth is driven by operating spend, with SG&A spending showing a slightly higher revenue elasticity than R&D: a 1% increase in SG&A is associated with about a 1.01% rise in revenue, while 1% more R&D yields about a 0.62% increase. These estimates come from a log-log model estimated on 32 quarters of data, but forecast reliability is weak, with a MAPE of 36.3% and a holdout test error where the model predicted $0.2B but actually delivered $0.7B (about 68% error). The FY outlook shows revenue around $0.8B, down 57.5% year over year, implying meaningful near-term downside unless new products or markets are added. Given the modest elasticity and the weak predictive performance, ROI on R&D and SG&A spending appears uncertain, underscoring the need for better pipeline execution and tighter cost management to support revenue stability.
Investment Thesis
At 36.3% MAPE, the model captures Moderna, Inc.'s broad revenue trajectory, though quarterly variability suggests sensitivity to external factors. R&D investment shows a 0.62x multiplier — each 1% increase in R&D spend is associated with a 0.62% revenue increase, signaling strong innovation-to-revenue conversion. Sales & marketing spend shows a 1.01x elasticity, suggesting effective go-to-market execution.
Revenue Forecast
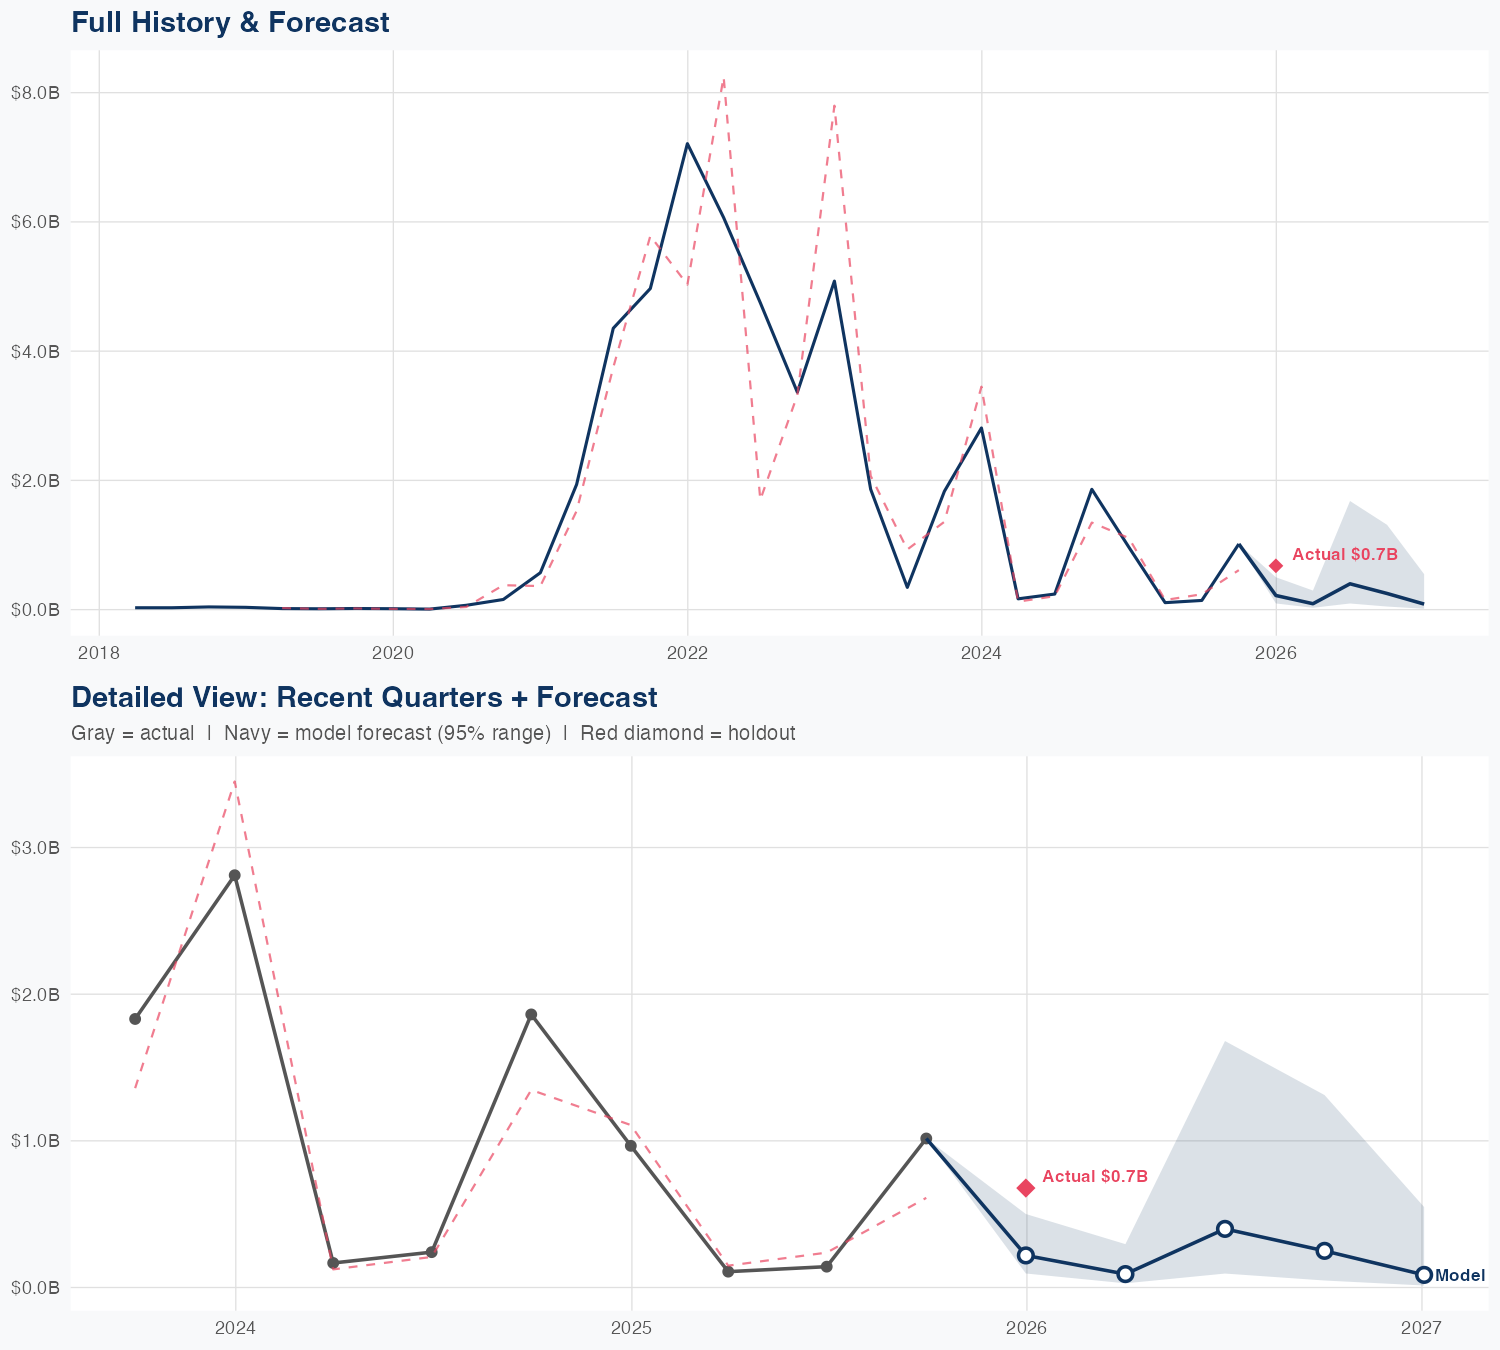
Quarterly Detail
| Quarter | Model Forecast | Actual | 95% Range | YoY Growth | Status |
|---|---|---|---|---|---|
| Q4 2025 | $0.2B | $0.7B | $0.1B – $0.5B | -77.4% | ✗ Outside range |
| Q2 2026 | $0.1B | $0.0B – $0.3B | -15.3% | ||
| Q3 2026 | $0.4B | $0.1B – $1.7B | +181.4% | ||
| Q4 2026 | $0.2B | $0.0B – $1.3B | -75.4% | ||
| Q1 2027 | $0.1B | $0.0B – $0.5B | -87.3% |
Seasonal Factors
| Fiscal Quarter | Seasonal Factor | vs Trend | Interpretation | Obs. |
|---|---|---|---|---|
| FQ1 (Sep–Nov) | 1.0133 | +1.3% | In line with trend | 7 |
| FQ2 (Dec–Feb) | 1.127 | +12.7% | +12.7% above trend | 7 |
| FQ3 (Mar–May) | 0.8482 | -15.2% | -15.2% below trend | 7 |
| FQ4 (Jun–Aug) | 1.1572 | +15.7% | +15.7% above trend | 7 |
How Spending Drives Revenue
Want this analysis for your portfolio?
I build custom revenue intelligence reports for investors and companies using SEC filing data, econometric modeling, and AI-powered insights.
Get in Touch