Strategy Inc MSTR
Revenue Intelligence Report • 62 quarters of SEC filing data • Updated 2026-03-15
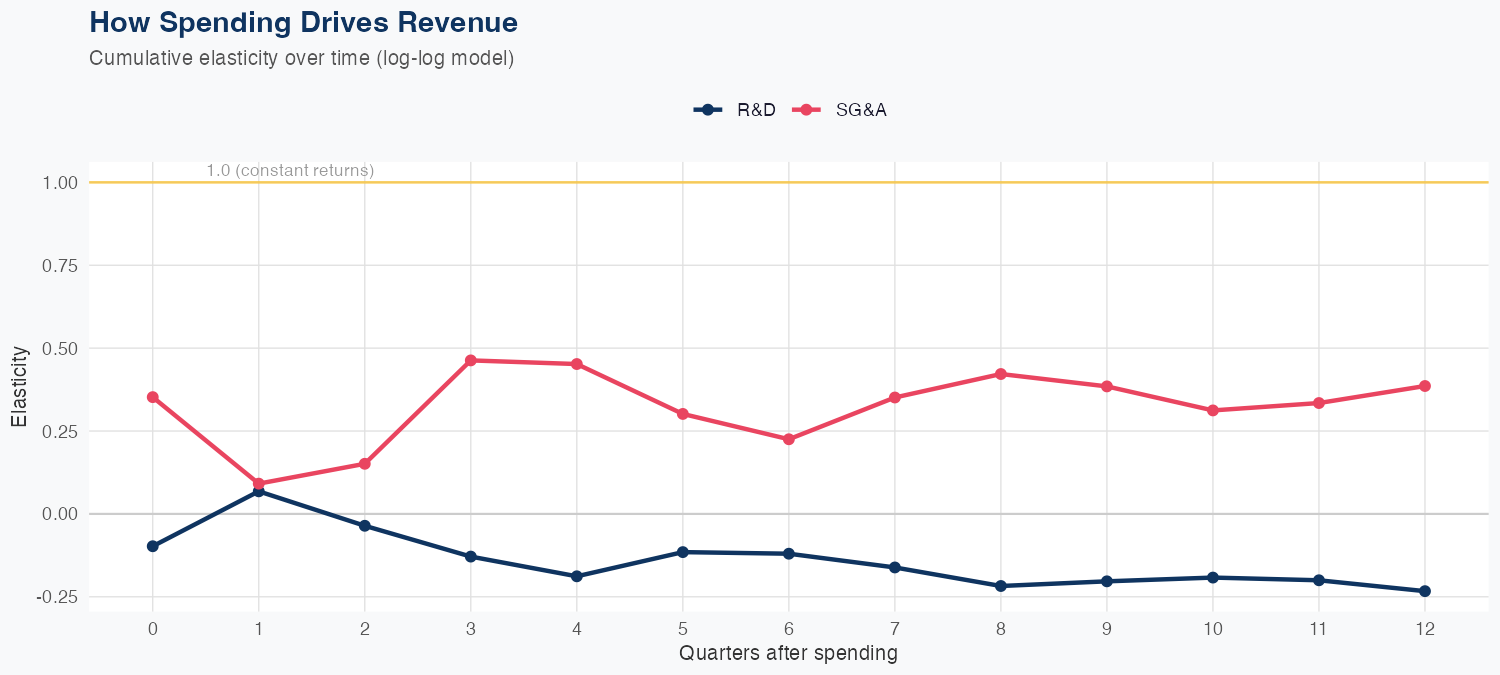
The revenue model shows SG&A spending drives revenue with an elasticity of +0.39% per 1% increase, while R&D spending reduces revenue with an elasticity of -0.23% per 1% increase, indicating a SG&A-led revenue dynamic in a log-log framework across 62 quarters. The model delivers 3.6% MAPE accuracy, with a holdout test predicting 127M vs actual 123M (about -3.2% error), reflecting reasonably solid out-of-sample performance. The FY revenue forecast stands at 499M, up 4.5% year over year, signaling modest topline growth under the current spend mix. In terms of ROI, SG&A investments show a positive but modest revenue return, while R&D appears to have a negative revenue impact in this framework, suggesting a strategic reallocation toward SG&A efficiency and targeted R&D optimization to improve returns and sustain growth.
Investment Thesis
The econometric model achieves strong accuracy (3.6% MAPE), suggesting Strategy Inc's revenue trajectory is well-characterized by its spending patterns. R&D spending currently shows a negative elasticity (-0.23x), which can indicate heavy investment in long-cycle initiatives not yet reflected in revenue. Sales & marketing spend shows a 0.39x elasticity, suggesting effective go-to-market execution.
Revenue Forecast
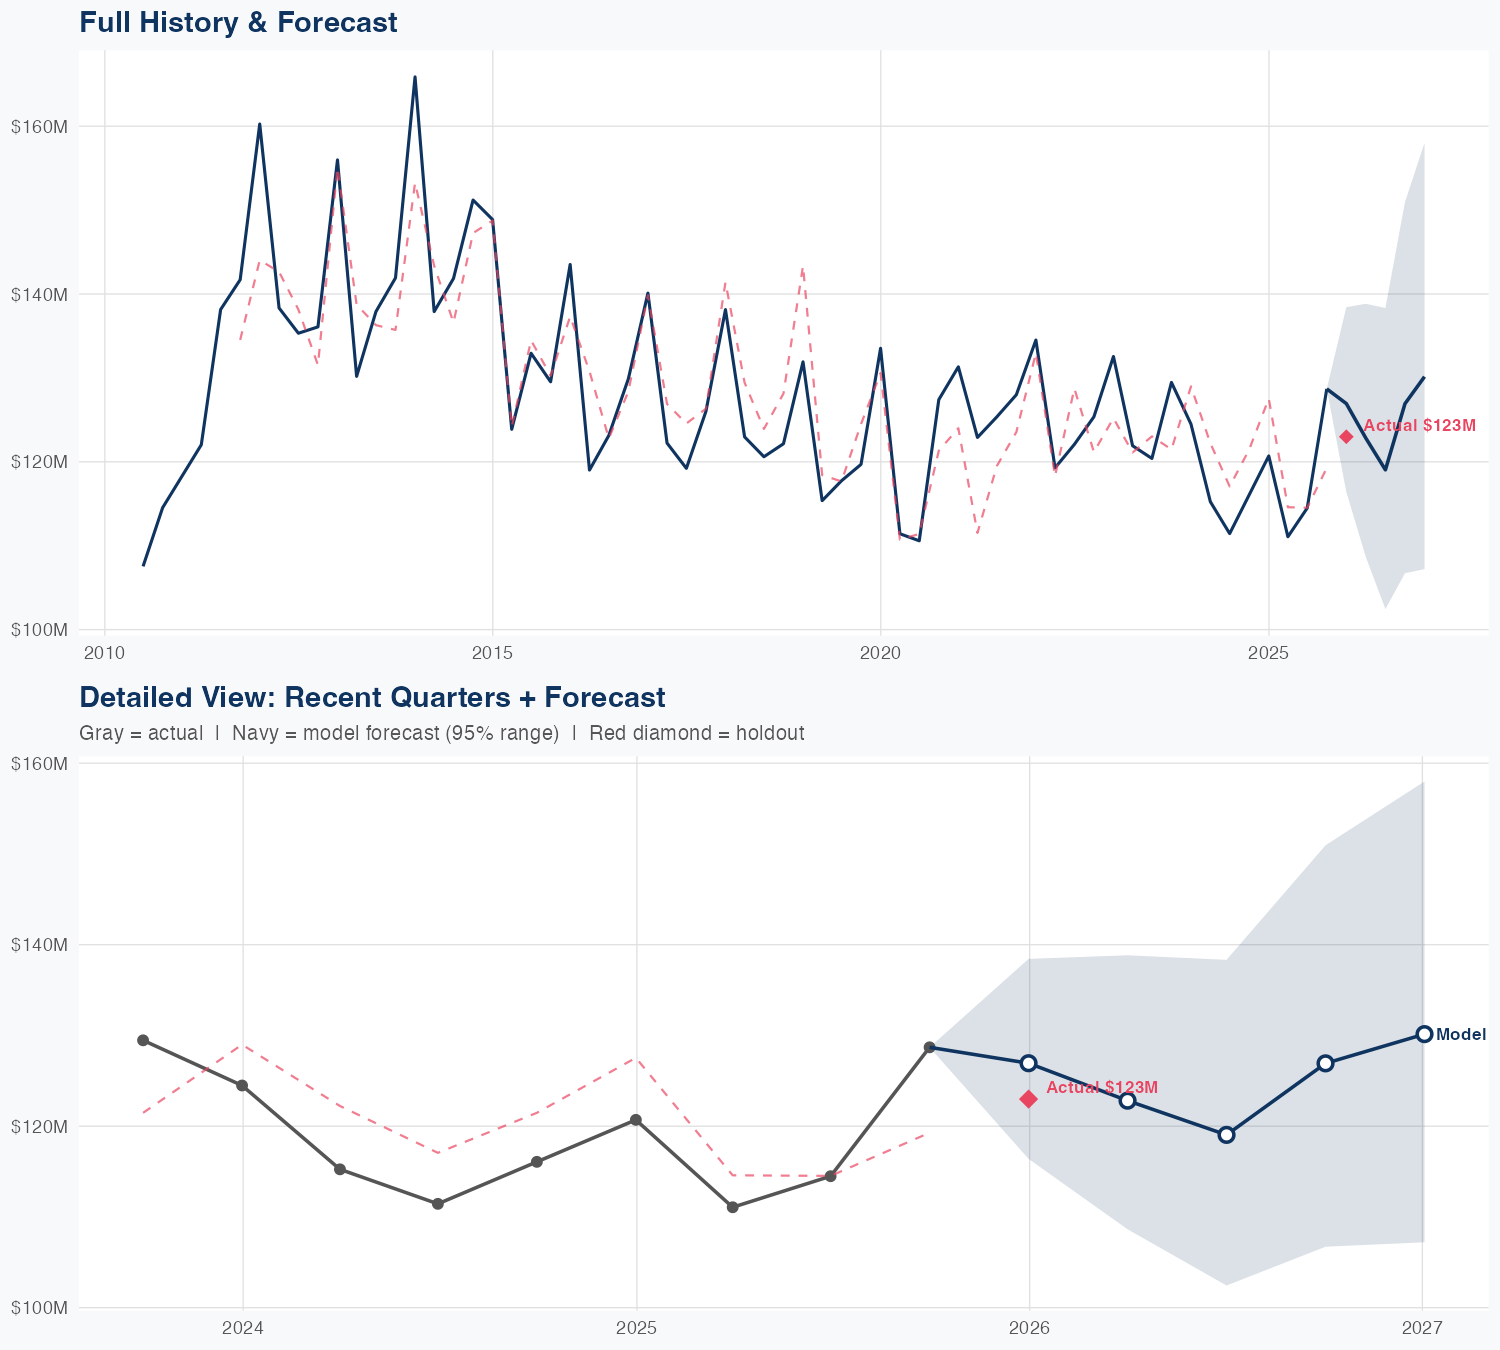
Quarterly Detail
| Quarter | Model Forecast | Actual | 95% Range | YoY Growth | Status |
|---|---|---|---|---|---|
| Q4 2025 | $127M | $123M | $116M – $138M | +5.2% | ✓ In range |
| Q2 2026 | $123M | $109M – $139M | +10.6% | ||
| Q3 2026 | $119M | $102M – $138M | +4.0% | ||
| Q4 2026 | $127M | $107M – $151M | -1.4% | ||
| Q1 2027 | $130M | $107M – $158M | +5.8% |
Seasonal Factors
| Fiscal Quarter | Seasonal Factor | vs Trend | Interpretation | Obs. |
|---|---|---|---|---|
| FQ1 (Sep–Nov) | 1.0346 | +3.5% | +3.5% above trend | 15 |
| FQ2 (Dec–Feb) | 1.0058 | +0.6% | In line with trend | 15 |
| FQ3 (Mar–May) | 0.9698 | -3.0% | -3.0% below trend | 14 |
| FQ4 (Jun–Aug) | 0.9927 | -0.7% | In line with trend | 14 |
How Spending Drives Revenue
Want this analysis for your portfolio?
I build custom revenue intelligence reports for investors and companies using SEC filing data, econometric modeling, and AI-powered insights.
Get in Touch