Mastec, Inc. MTZ
Revenue Intelligence Report • 62 quarters of SEC filing data • Updated 2026-03-15
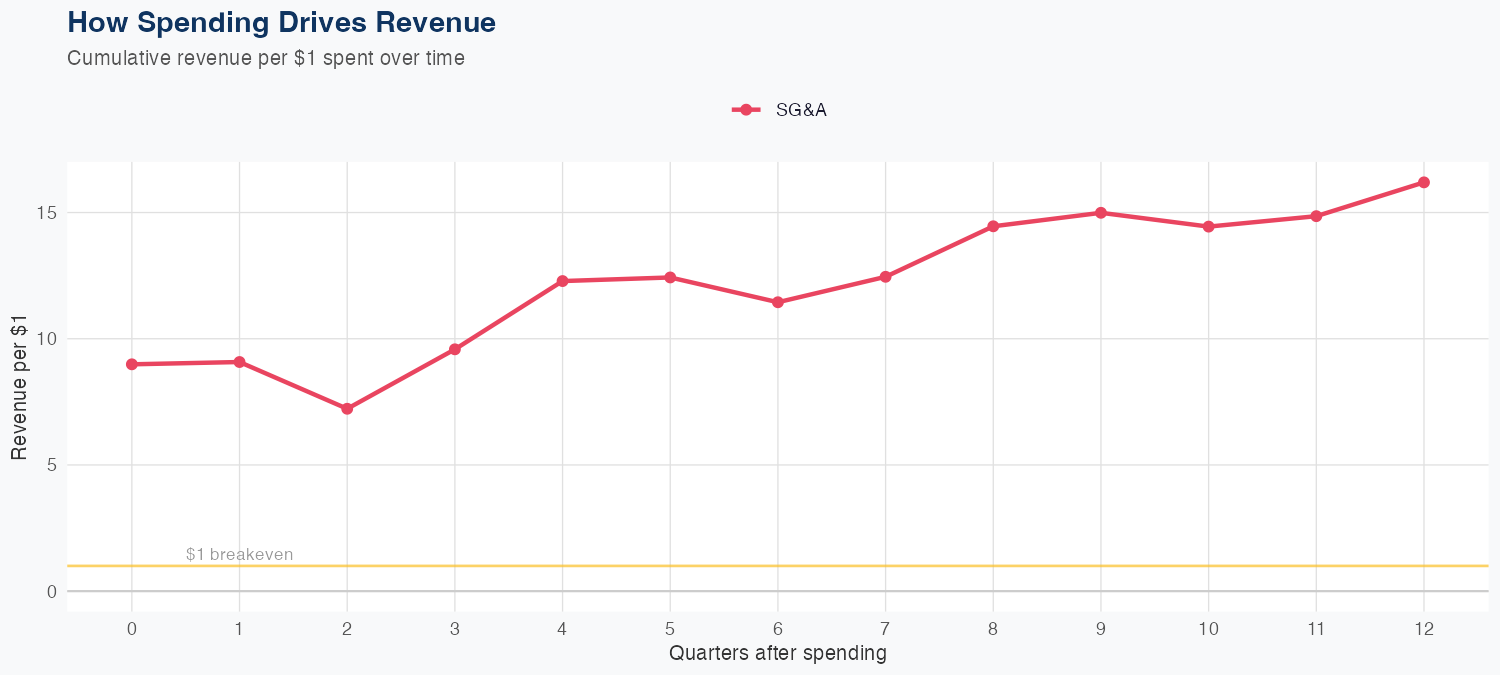
Revenue is driven primarily by SG&A spending, which the linear model ties to long-run revenue at about $16.20 generated per $1 of SG&A, reflecting strong expense-to-growth leverage observed across 62 quarters of data. The model shows decent but imperfect predictive accuracy, with a holdout forecast of $3.6B vs. $3.9B actual (8% error) and an overall MAPE of 8.2%. For the full year, management guidance implies roughly $15B in revenue, up about 4.2% year over year, indicating steady growth at the current spend efficiency. Outlook: if SG&A-driven leverage remains intact, the revenue path should stay modestly positive, though the lack of visible R&D data adds some uncertainty around other growth drivers and potential upside.
Investment Thesis
At 8.2% MAPE, the model captures Mastec, Inc.'s broad revenue trajectory, though quarterly variability suggests sensitivity to external factors. Each $1 of SG&A spending generates $16.20 in revenue, reflecting strong commercial efficiency.
Revenue Forecast
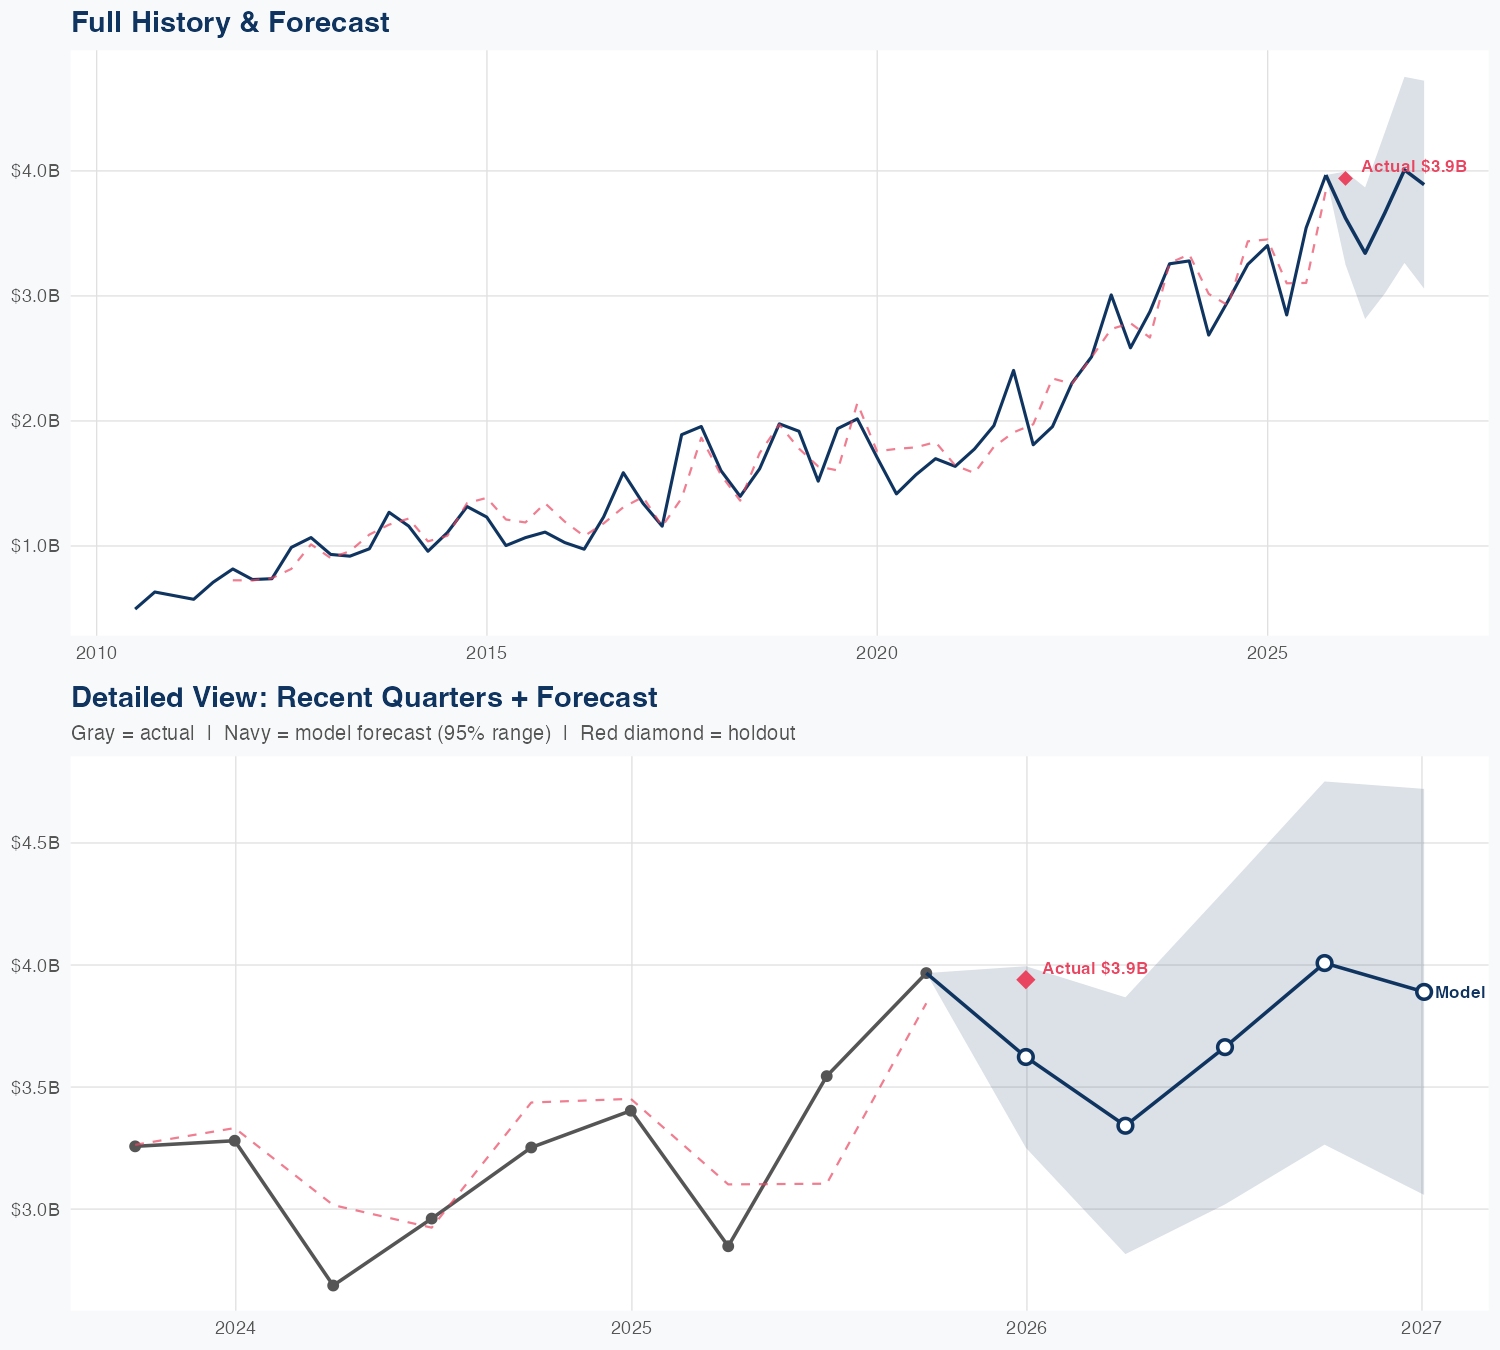
Quarterly Detail
| Quarter | Model Forecast | Actual | 95% Range | YoY Growth | Status |
|---|---|---|---|---|---|
| Q4 2025 | $3.6B | $3.9B | $3.3B – $4.0B | +6.5% | ✓ In range |
| Q2 2026 | $3.3B | $2.8B – $3.9B | +17.3% | ||
| Q3 2026 | $3.7B | $3.0B – $4.3B | +3.4% | ||
| Q4 2026 | $4.0B | $3.3B – $4.8B | +1.0% | ||
| Q1 2027 | $3.9B | $3.1B – $4.7B | -1.3% |
Seasonal Factors
| Fiscal Quarter | Seasonal Factor | vs Trend | Interpretation | Obs. |
|---|---|---|---|---|
| FQ1 (Sep–Nov) | 1.003 | +0.3% | In line with trend | 15 |
| FQ2 (Dec–Feb) | 0.9859 | -1.4% | In line with trend | 15 |
| FQ3 (Mar–May) | 0.928 | -7.2% | -7.2% below trend | 14 |
| FQ4 (Jun–Aug) | 1.0439 | +4.4% | +4.4% above trend | 14 |
How Spending Drives Revenue
Want this analysis for your portfolio?
I build custom revenue intelligence reports for investors and companies using SEC filing data, econometric modeling, and AI-powered insights.
Get in Touch