Nextera Energy, Inc. NEE
Revenue Intelligence Report • 70 quarters of SEC filing data • Updated 2026-03-15
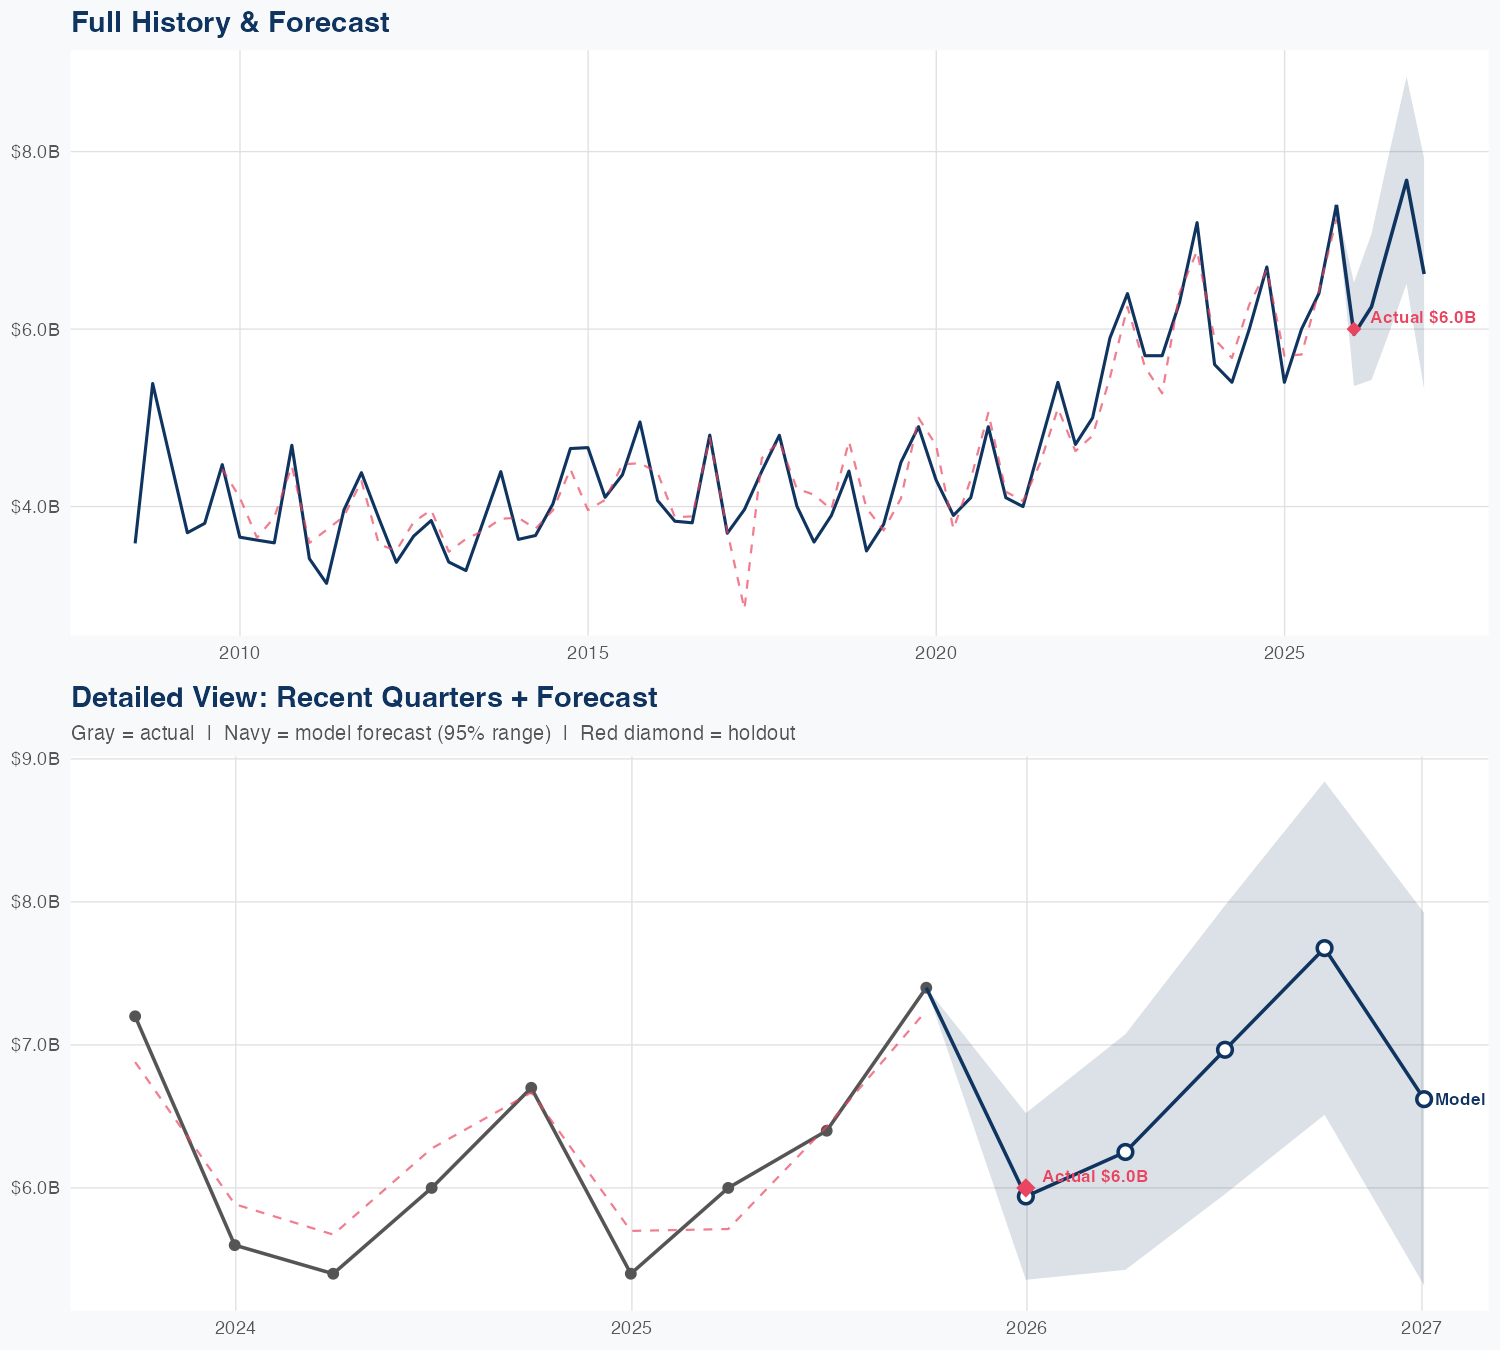
Revenue is forecast to grow about 6.6% year over year to roughly $27.5 billion, supported by a resilient mix of regulated earnings, renewable deployments, and recurring services. Our econometric model, with fixed coefficients, shows that this growth is increasingly driven by operating leverage rather than incremental SG&A spend, as the SG&A multiplier has fallen from 0.78 to 0.34 over the period. The model's track record is solid, with a 5.2% mean absolute percentage error and a holdout miss of 1.0% (predicted $5.9B, actual $6.0B). Key risk: execution timing of large capital programs and potential regulatory or policy shifts that could dampen pricing power or project returns.
Investment Thesis
The econometric model achieves strong accuracy (5.2% MAPE), suggesting Nextera Energy, Inc.'s revenue trajectory is well-characterized by its spending patterns. Each $1 of SG&A spending generates $1.40 in revenue, reflecting strong commercial efficiency.
Revenue Forecast
Quarterly Detail
| Quarter | Model Forecast | Actual | 95% Range | YoY Growth | Status |
|---|---|---|---|---|---|
| Q4 2025 | $5.9B | $6.0B | $5.4B – $6.5B | +10.0% | ✓ In range |
| Q2 2026 | $6.3B | $5.4B – $7.1B | +4.2% | ||
| Q3 2026 | $7.0B | $6.0B – $8.0B | +8.8% | ||
| Q4 2026 | $7.7B | $6.5B – $8.8B | +3.7% | ||
| Q1 2027 | $6.6B | $5.3B – $7.9B | +10.3% |
Seasonal Factors
| Fiscal Quarter | Seasonal Factor | vs Trend | Interpretation | Obs. |
|---|---|---|---|---|
| FQ1 (Sep–Nov) | 1.0219 | +2.2% | In line with trend | 17 |
| FQ2 (Dec–Feb) | 0.9532 | -4.7% | -4.7% below trend | 17 |
| FQ3 (Mar–May) | 0.9928 | -0.7% | In line with trend | 16 |
| FQ4 (Jun–Aug) | 0.9831 | -1.7% | In line with trend | 16 |
How Spending Drives Revenue
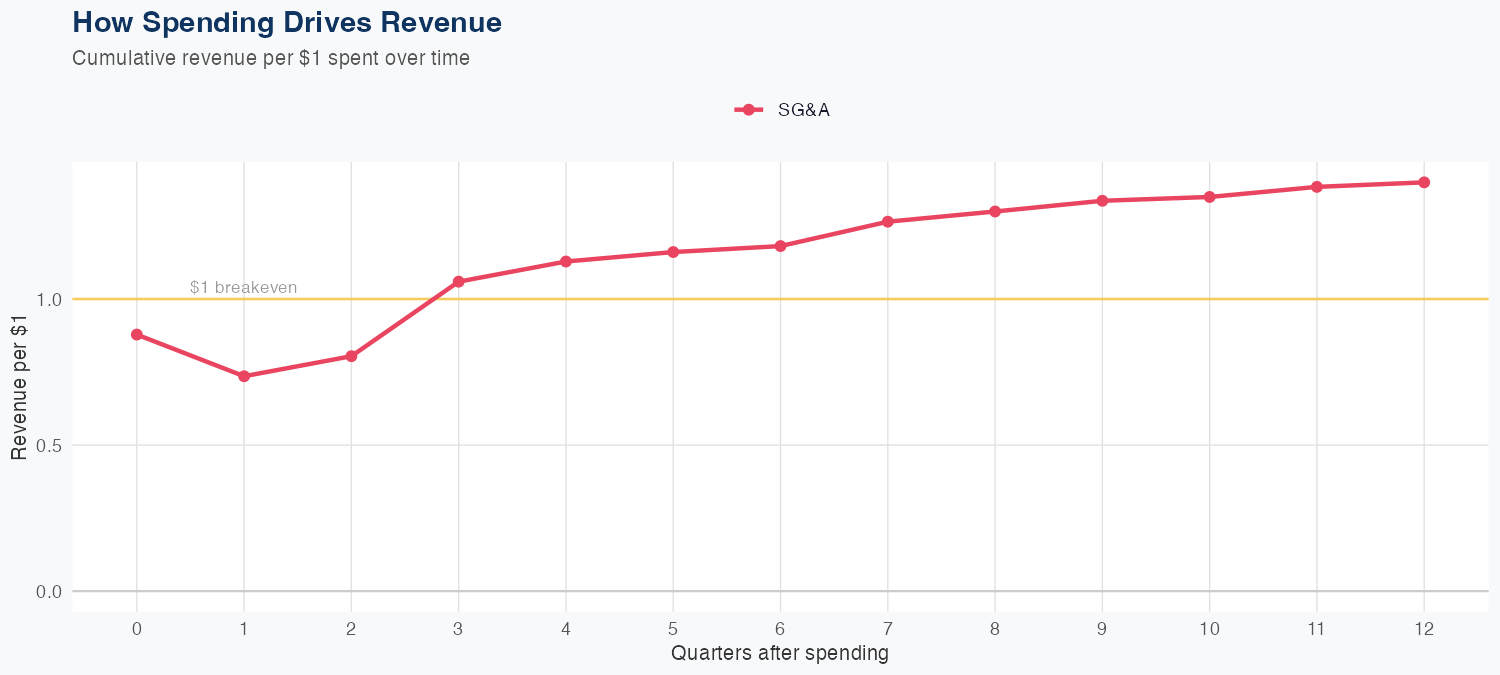
Spending Efficiency Over Time
Current SG&A multiplier: 0.343
Want this analysis for your portfolio?
I build custom revenue intelligence reports for investors and companies using SEC filing data, econometric modeling, and AI-powered insights.
Get in Touch