Annaly Capital Management Inc NLY
Revenue Intelligence Report • 68 quarters of SEC filing data • Updated 2026-03-15
Annaly Capital Management Inc has a forecasted full-year revenue of $1.2B, a +9.5% year-over-year change, based on 68 quarters of SEC filing data. The ARDL model has 72.2% MAPE.
Investment Thesis
At 72.2% MAPE, the model captures Annaly Capital Management Inc's broad revenue trajectory, though quarterly variability suggests sensitivity to external factors.
Next FY Revenue
$1.24B
+9.5% YoY
SG&A Multiplier
$-3.45 per $1
Model Accuracy
72.2% MAPE
Holdout validation: The model predicted $289B vs the actual $367B — an error of 21.3%.
⚠ Model limitation:
This company shows negative spending multipliers, meaning increases in spending have not directly translated into revenue growth. This typically occurs with commodity-driven companies or hypergrowth companies.
Note:
Annaly Capital Management Inc does not report R&D expenses separately. This analysis uses SG&A spending only.
Investor insight:
Actual revenue ($367M) came in 21% above the spending-based forecast ($289M). This suggests that Annaly Capital Management Inc's recent revenue growth is driven significantly by external demand factors — such as market pricing, product cycle tailwinds, or structural demand shifts — beyond what its R&D and SG&A spending alone would predict.
Revenue Forecast
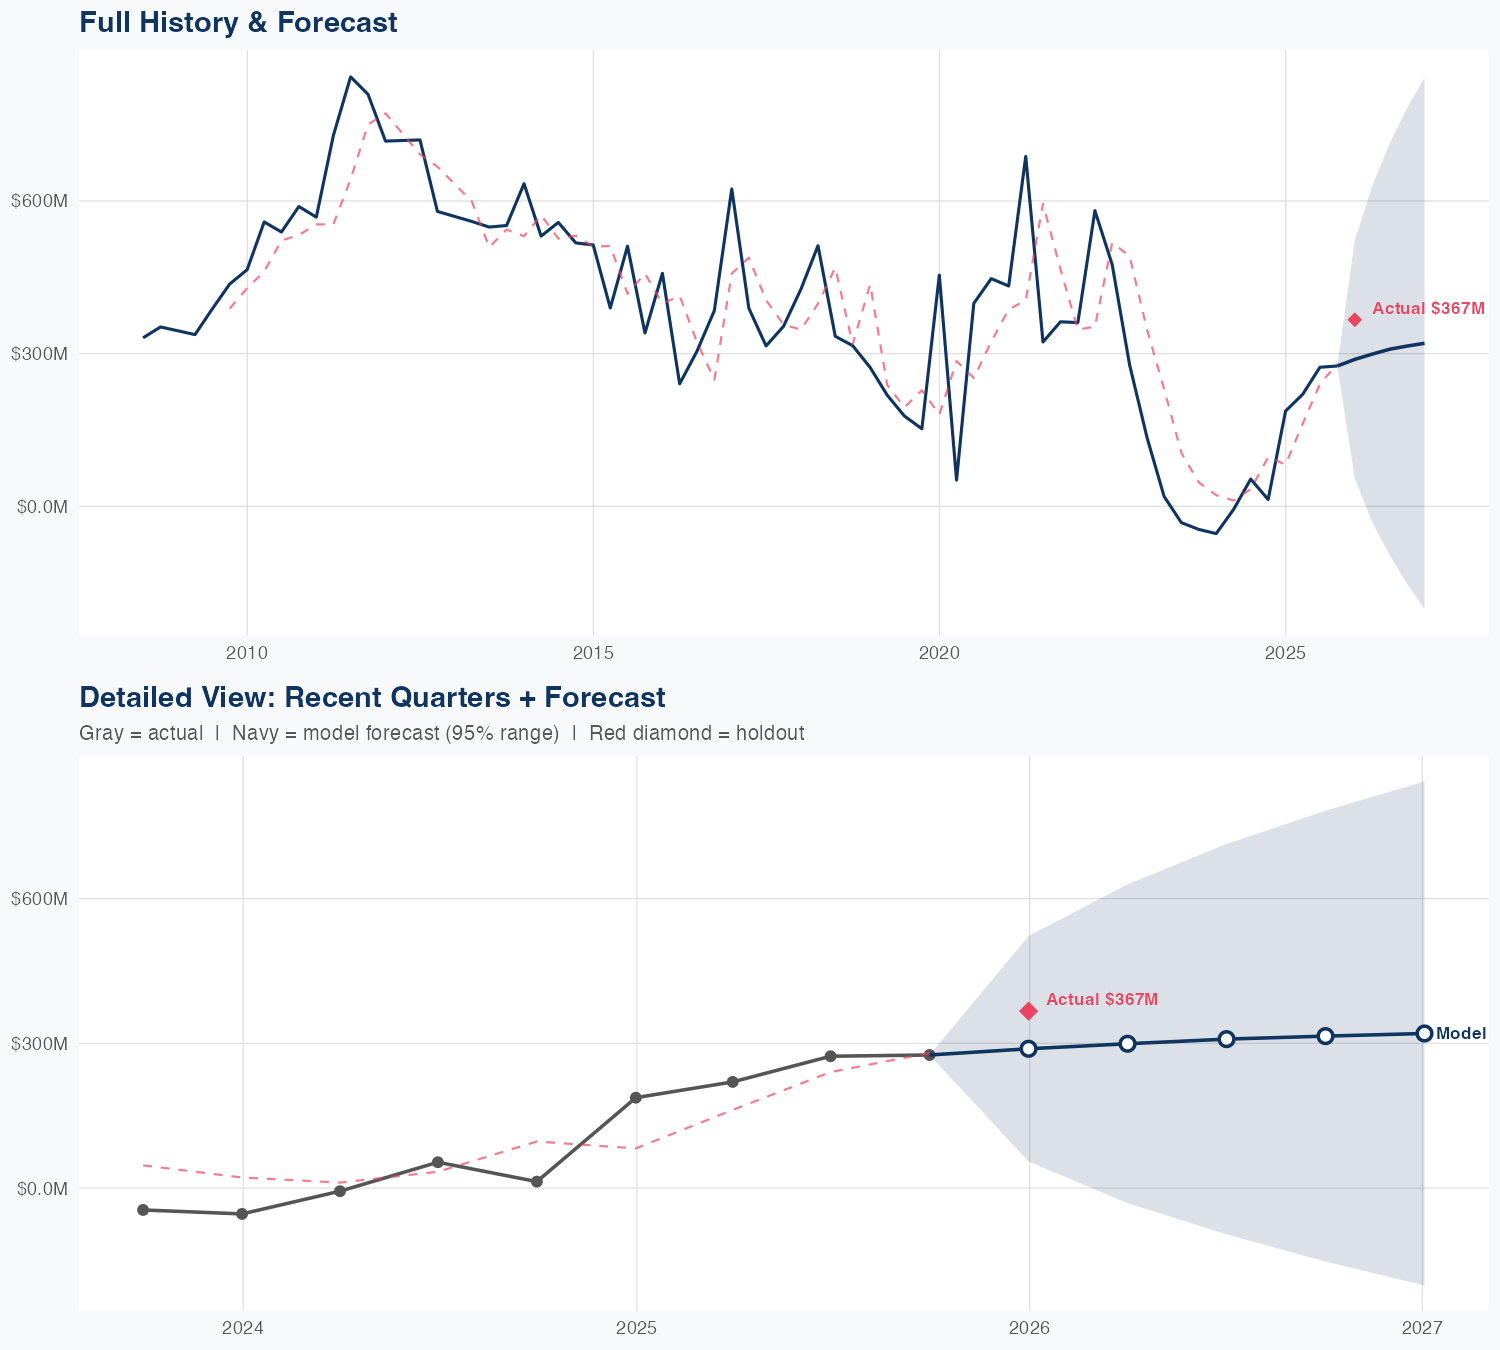
Quarterly Detail
| Quarter | Model Forecast | Actual | 95% Range | YoY Growth | Status |
|---|---|---|---|---|---|
| Q4 2025 | $289B | $367B | $55B – $522B | +54.1% | ✓ In range |
| Q2 2026 | $299B | $-31B – $629B | +35.9% | ||
| Q3 2026 | $309B | $-96B – $713B | +13.0% | ||
| Q4 2026 | $315B | $-152B – $782B | +14.2% | ||
| Q1 2027 | $320B | $-202B – $843B | -12.6% |
Seasonal Factors
Multiplicative seasonal adjustment:
These factors capture Annaly Capital Management Inc's systematic quarterly revenue patterns relative to the trend model.
A factor of 1.05 means that quarter typically runs 5% above the underlying trend; 0.95 means 5% below.
Factors are computed as the median of (actual / fitted) across all available quarters.
| Fiscal Quarter | Seasonal Factor | vs Trend | Interpretation | Obs. |
|---|---|---|---|---|
| FQ1 (Sep–Nov) | 0.9845 | -1.5% | In line with trend | 17 |
| FQ2 (Dec–Feb) | 1.1187 | +11.9% | +11.9% above trend | 16 |
| FQ3 (Mar–May) | 0.9278 | -7.2% | -7.2% below trend | 15 |
| FQ4 (Jun–Aug) | 1.0407 | +4.1% | +4.1% above trend | 16 |
How Spending Drives Revenue
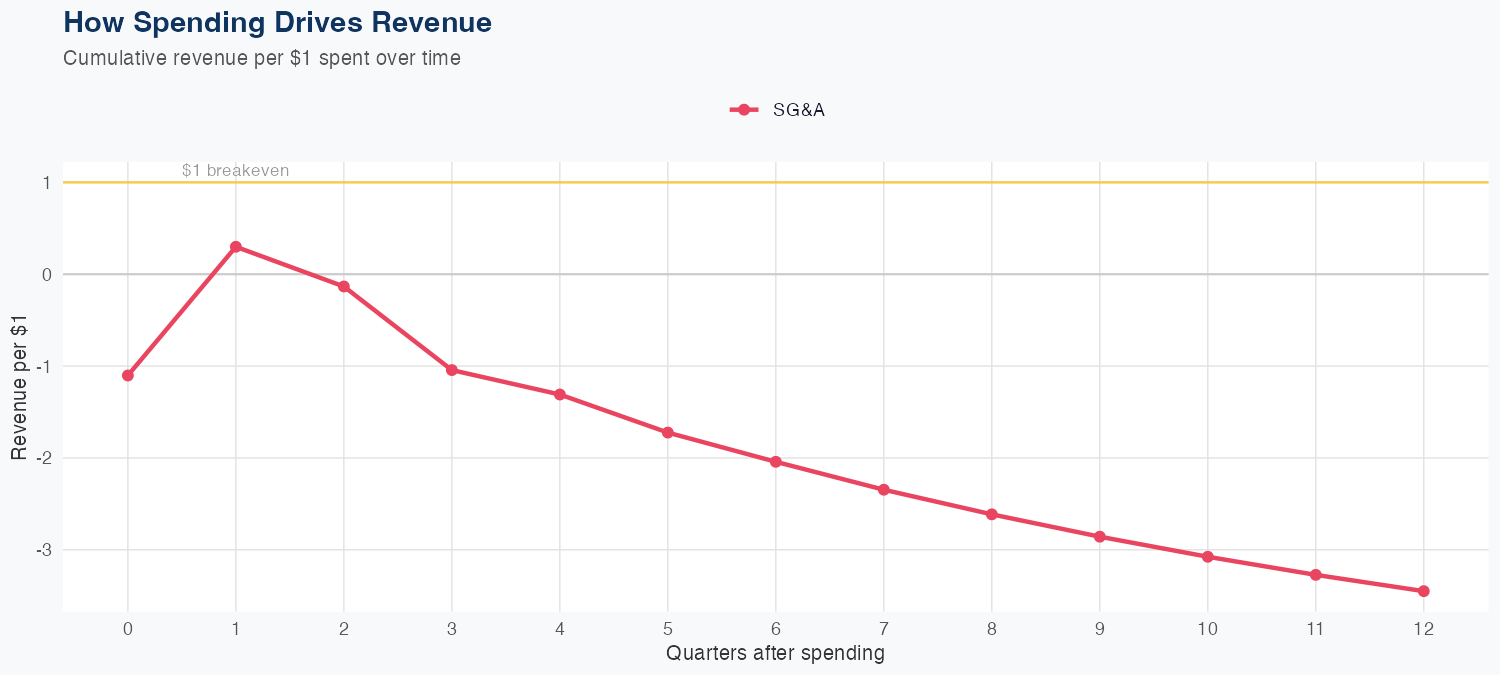
Reading this chart:
Each line shows the cumulative revenue generated per $1 spent over subsequent quarters. The effect builds over 4-5 quarters as investments mature.
Want this analysis for your portfolio?
I build custom revenue intelligence reports for investors and companies using SEC filing data, econometric modeling, and AI-powered insights.
Get in Touch