Old Dominion Freight Line, Inc. ODFL
Revenue Intelligence Report • 36 quarters of SEC filing data • Updated 2026-03-15
ODFL's revenue of about $5.1B is forecast to decline roughly 7% year over year, as near-term demand remains soft, even as the long-run structural growth runway sits around 8% per year. The binding constraint on growth is delivery capacity—the fleet, facilities, and driver availability needed to absorb SG&A investment and translate it into higher volumes. Our econometric model shows about 8% structural/platform growth with roughly 92% of incremental topline coming from SG&A spending; SG&A elasticity has risen toward 1.4x, meaning each additional dollar of SG&A yields outsized revenue gains. The key risk is that capacity expansion lags demand, capping the upside from SG&A investments and leaving revenue growth vulnerable to external shocks such as labor constraints or regulatory changes.
Investment Thesis
Our ARDL model tracks Old Dominion Freight Line, Inc.'s revenue with exceptional precision (2.3% MAPE), indicating highly predictable cash flows. Sales & marketing spend shows a 1.40x elasticity, suggesting effective go-to-market execution.
Revenue Forecast
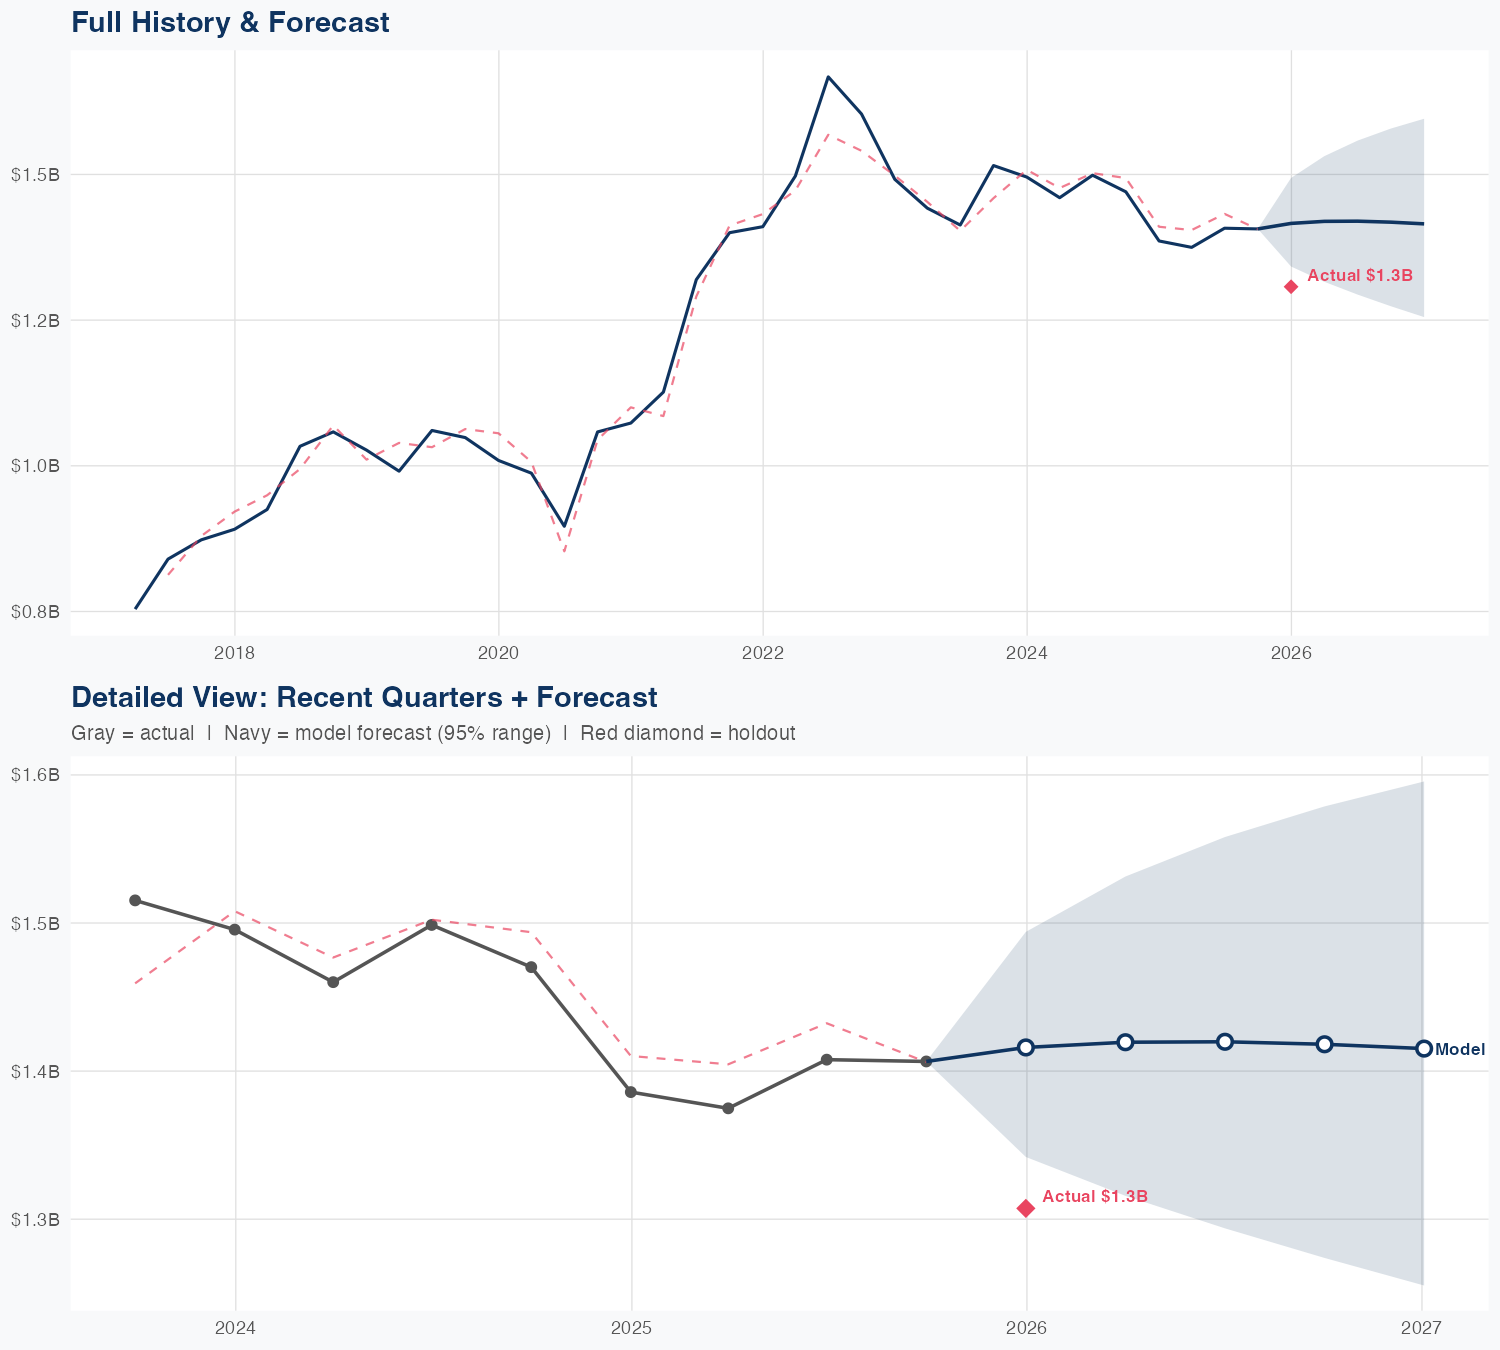
Quarterly Detail
| Quarter | Model Forecast | Actual | 95% Range | YoY Growth | Status |
|---|---|---|---|---|---|
| Q4 2025 | $1.3B | $1.3B | $1.2B – $1.4B | -6.1% | ✓ In range |
| Q2 2026 | $1.3B | $1.2B – $1.4B | -5.8% | ||
| Q3 2026 | $1.3B | $1.2B – $1.4B | -6.0% | ||
| Q4 2026 | $1.3B | $1.2B – $1.4B | -8.7% | ||
| Q1 2027 | $1.2B | $1.1B – $1.3B | -7.4% |
Seasonal Factors
| Fiscal Quarter | Seasonal Factor | vs Trend | Interpretation | Obs. |
|---|---|---|---|---|
| FQ1 (Sep–Nov) | 0.9925 | -0.7% | In line with trend | 9 |
| FQ2 (Dec–Feb) | 0.9827 | -1.7% | In line with trend | 9 |
| FQ3 (Mar–May) | 0.9888 | -1.1% | In line with trend | 8 |
| FQ4 (Jun–Aug) | 1.0278 | +2.8% | In line with trend | 9 |
How Spending Drives Revenue
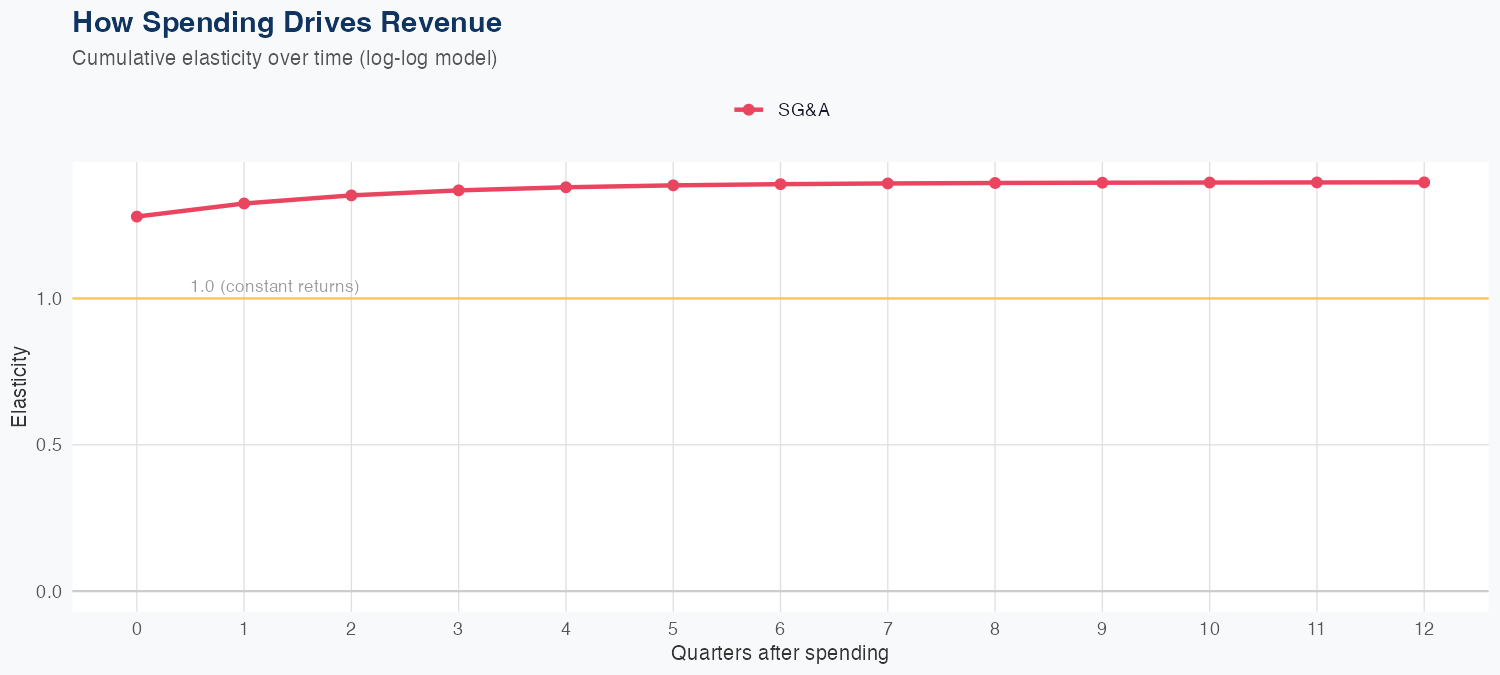
Spending Efficiency Over Time
Current SG&A elasticity: 1.4713x
Want this analysis for your portfolio?
I build custom revenue intelligence reports for investors and companies using SEC filing data, econometric modeling, and AI-powered insights.
Get in Touch