Principal Financial Group, inc PFG
Revenue Intelligence Report • 70 quarters of SEC filing data • Updated 2026-03-15
The revenue outlook for Principal Financial Group is modestly negative near term, with FY revenue around $15.4 billion and a forecasted YoY decline of roughly 1.2%. Our econometric model shows SG&A elasticity near 0.97x, so a 1% rise in SG&A is linked to about a 0.97% revenue gain, implying limited near-term topline impact from cost spend. More importantly, elasticity has trended lower from 1.14x to 0.31x across history, signaling rising operating leverage and that growth can come from platform scale, pricing power, and recurring revenue beyond incremental spending. Forecast accuracy is moderate: MAPE 6.4%, and a holdout miss of 11.9% (predicted $4.0B vs actual $4.6B), cautions that the outlook could shift with sharper SG&A moves or macro headwinds.
Investment Thesis
The econometric model achieves strong accuracy (6.4% MAPE), suggesting Principal Financial Group, inc's revenue trajectory is well-characterized by its spending patterns. Sales & marketing spend shows a 0.97x elasticity, suggesting effective go-to-market execution.
Revenue Forecast
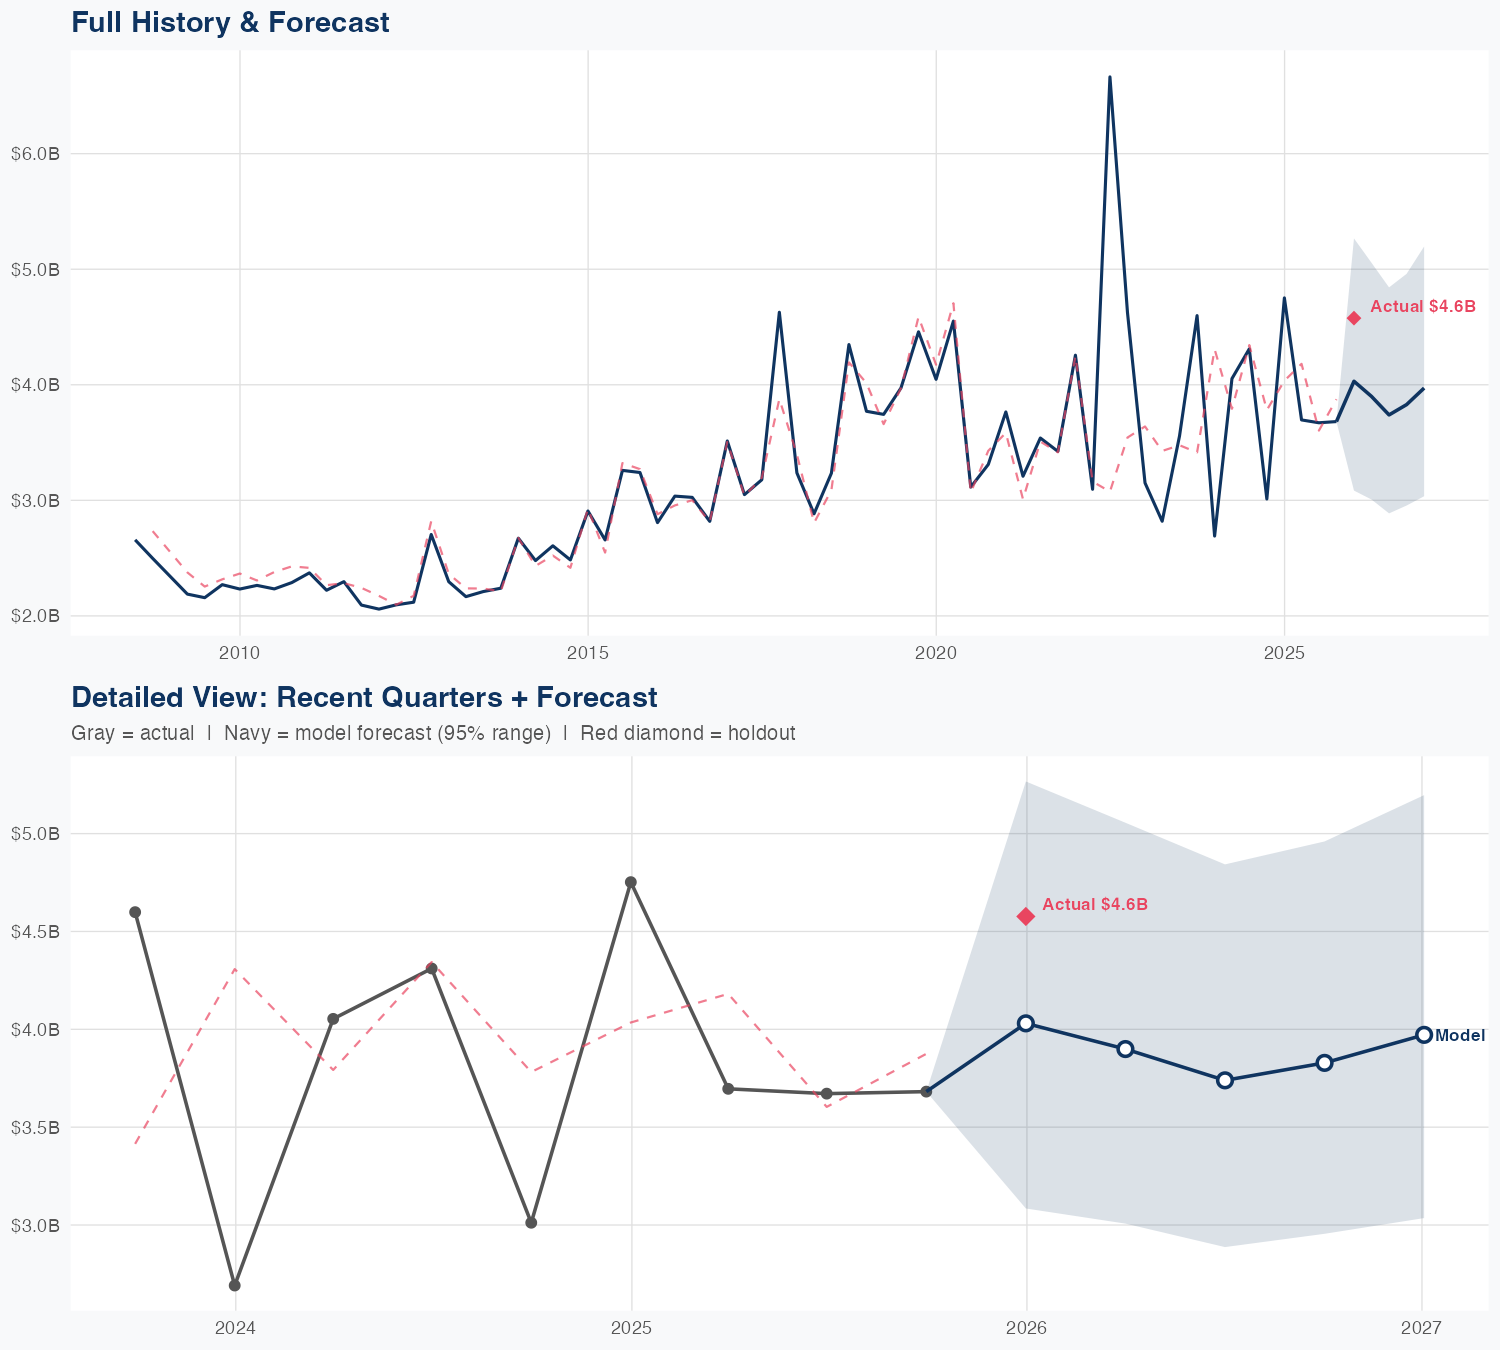
Quarterly Detail
| Quarter | Model Forecast | Actual | 95% Range | YoY Growth | Status |
|---|---|---|---|---|---|
| Q4 2025 | $4.0B | $4.6B | $3.1B – $5.3B | -15.2% | ✓ In range |
| Q2 2026 | $3.9B | $3.0B – $5.1B | +5.5% | ||
| Q3 2026 | $3.7B | $2.9B – $4.8B | +1.9% | ||
| Q4 2026 | $3.8B | $3.0B – $5.0B | +4.0% | ||
| Q1 2027 | $4.0B | $3.0B – $5.2B | -13.2% |
Seasonal Factors
| Fiscal Quarter | Seasonal Factor | vs Trend | Interpretation | Obs. |
|---|---|---|---|---|
| FQ1 (Sep–Nov) | 0.9912 | -0.9% | In line with trend | 18 |
| FQ2 (Dec–Feb) | 0.9747 | -2.5% | In line with trend | 17 |
| FQ3 (Mar–May) | 0.9995 | -0.0% | In line with trend | 17 |
| FQ4 (Jun–Aug) | 1.0057 | +0.6% | In line with trend | 17 |
How Spending Drives Revenue
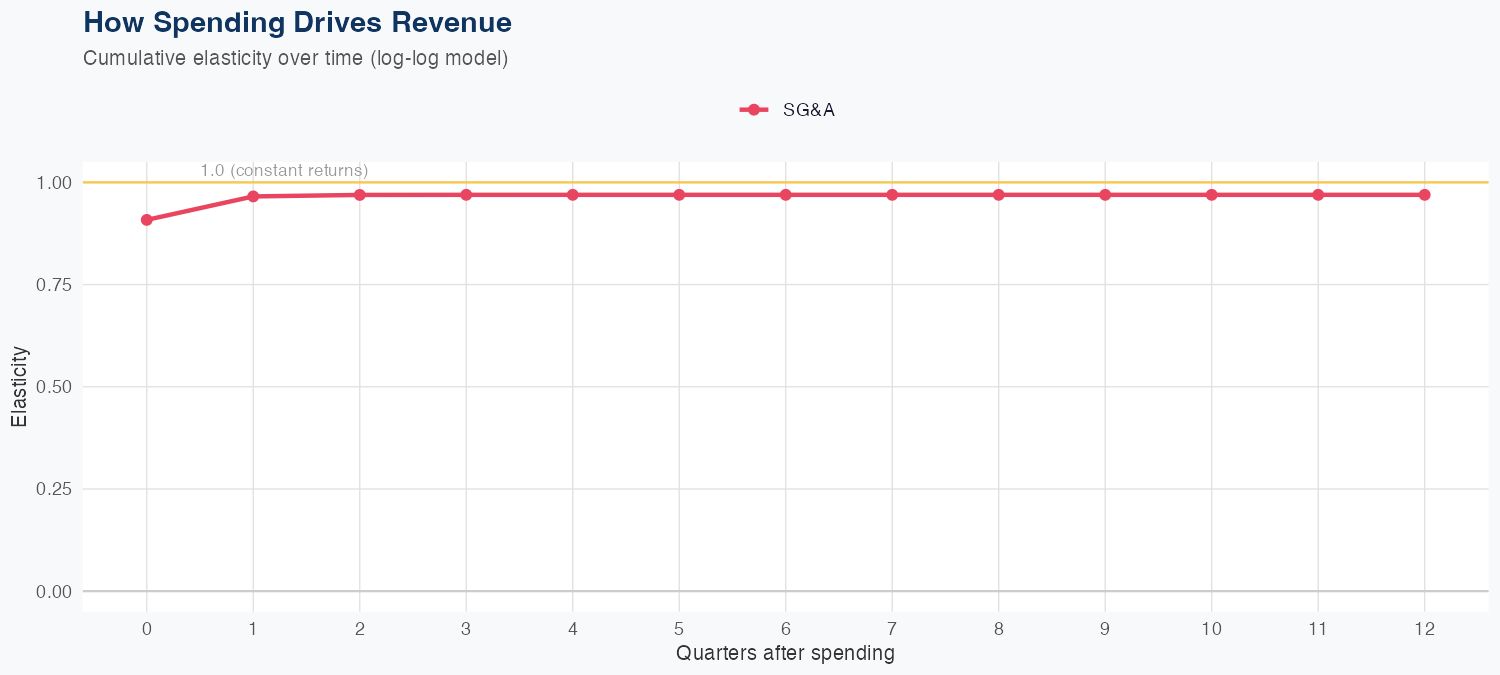
Spending Efficiency Over Time
Current SG&A elasticity: 0.3094x
Want this analysis for your portfolio?
I build custom revenue intelligence reports for investors and companies using SEC filing data, econometric modeling, and AI-powered insights.
Get in Touch