Progressive Corp/Oh/ PGR
Revenue Intelligence Report • 70 quarters of SEC filing data • Updated 2026-03-15
Revenue is set to grow roughly 14% year over year to about $114 billion, as Progressive benefits from continued pricing discipline and favorable mix in core auto and homeowners lines. Our econometric model, a log-log framework with fixed coefficients estimated over 70 quarters, supports the outlook and shows holdout accuracy within about 2% (predicted $23.2B vs actual $22.7B) and an overall MAPE of 2.6%, underscoring forecast credibility. Time-varying elasticity shows SG&A's impact on revenue has risen from negative to around 0.40x, meaning incremental SG&A spend is now more effective at driving topline growth than in the prior period. Key risk: a sharper catastrophe loss burden or a sudden reversal in rate increases could erode the revenue trajectory and temper the implied growth path.
Investment Thesis
Our ARDL model tracks Progressive Corp/Oh/'s revenue with exceptional precision (2.6% MAPE), indicating highly predictable cash flows. Sales & marketing spend shows a 1.04x elasticity, suggesting effective go-to-market execution.
Revenue Forecast
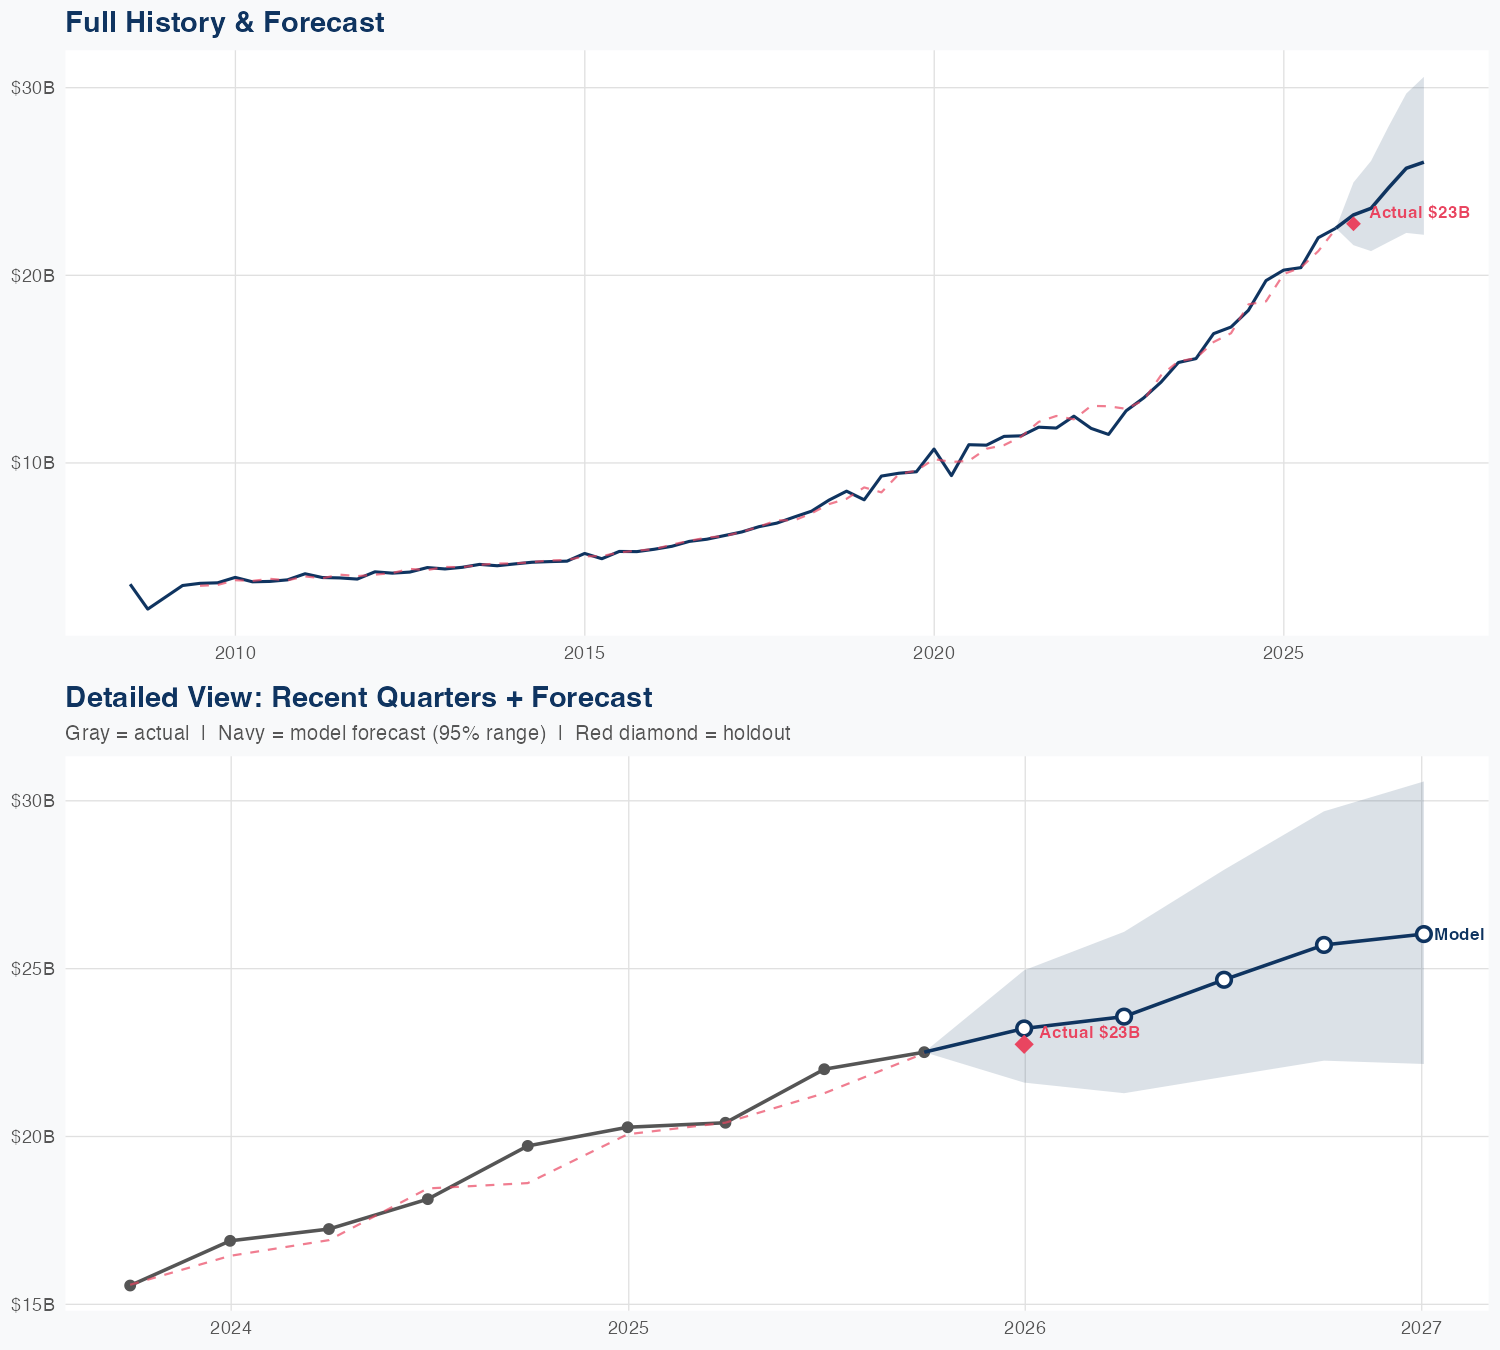
Quarterly Detail
| Quarter | Model Forecast | Actual | 95% Range | YoY Growth | Status |
|---|---|---|---|---|---|
| Q4 2025 | $23B | $23B | $22B – $25B | +14.5% | ✓ In range |
| Q2 2026 | $24B | $21B – $26B | +15.5% | ||
| Q3 2026 | $25B | $22B – $28B | +12.1% | ||
| Q4 2026 | $26B | $22B – $30B | +14.2% | ||
| Q1 2027 | $26B | $22B – $31B | +14.4% |
Seasonal Factors
| Fiscal Quarter | Seasonal Factor | vs Trend | Interpretation | Obs. |
|---|---|---|---|---|
| FQ1 (Sep–Nov) | 0.9939 | -0.6% | In line with trend | 17 |
| FQ2 (Dec–Feb) | 1.0136 | +1.4% | In line with trend | 17 |
| FQ3 (Mar–May) | 0.9988 | -0.1% | In line with trend | 16 |
| FQ4 (Jun–Aug) | 0.996 | -0.4% | In line with trend | 17 |
How Spending Drives Revenue
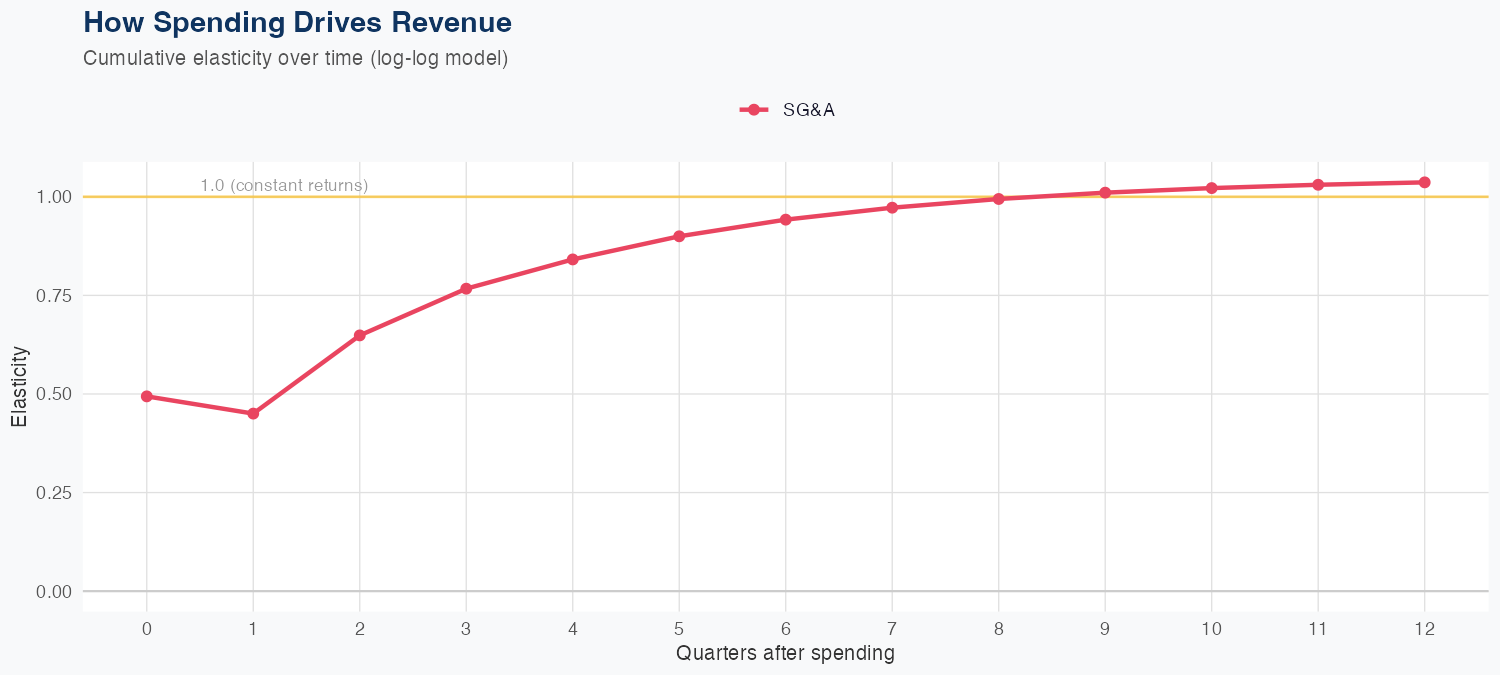
Spending Efficiency Over Time
Current SG&A elasticity: 0.3958x
Want this analysis for your portfolio?
I build custom revenue intelligence reports for investors and companies using SEC filing data, econometric modeling, and AI-powered insights.
Get in Touch