Pnc Financial Services Group, Inc PNC
Revenue Intelligence Report • 70 quarters of SEC filing data • Updated 2026-03-15
PNC's revenue is on a modest growth path, totaling about $23.7 billion this year with a forecast of +2.5% year over year, underpinned by structural/platform expansion and durable fee-based momentum. Our econometric model attributes roughly 66% of the growth to structural/platform expansion, with SG&A spending about 34% and R&D essentially zero. The binding constraint on revenue growth is balance-sheet capacity—capital adequacy and regulatory constraints that limit incremental lending and the funding of platform-scale initiatives; SG&A is increasingly maintenance rather than a growth lever. Key risk: a softer credit cycle or tighter capital requirements could temper loan growth and blunt the revenue trajectory beyond the current +2.5% outlook.
Investment Thesis
The econometric model achieves strong accuracy (4.1% MAPE), suggesting Pnc Financial Services Group, Inc's revenue trajectory is well-characterized by its spending patterns. Each $1 of SG&A spending generates $1.53 in revenue, reflecting strong commercial efficiency.
Revenue Forecast
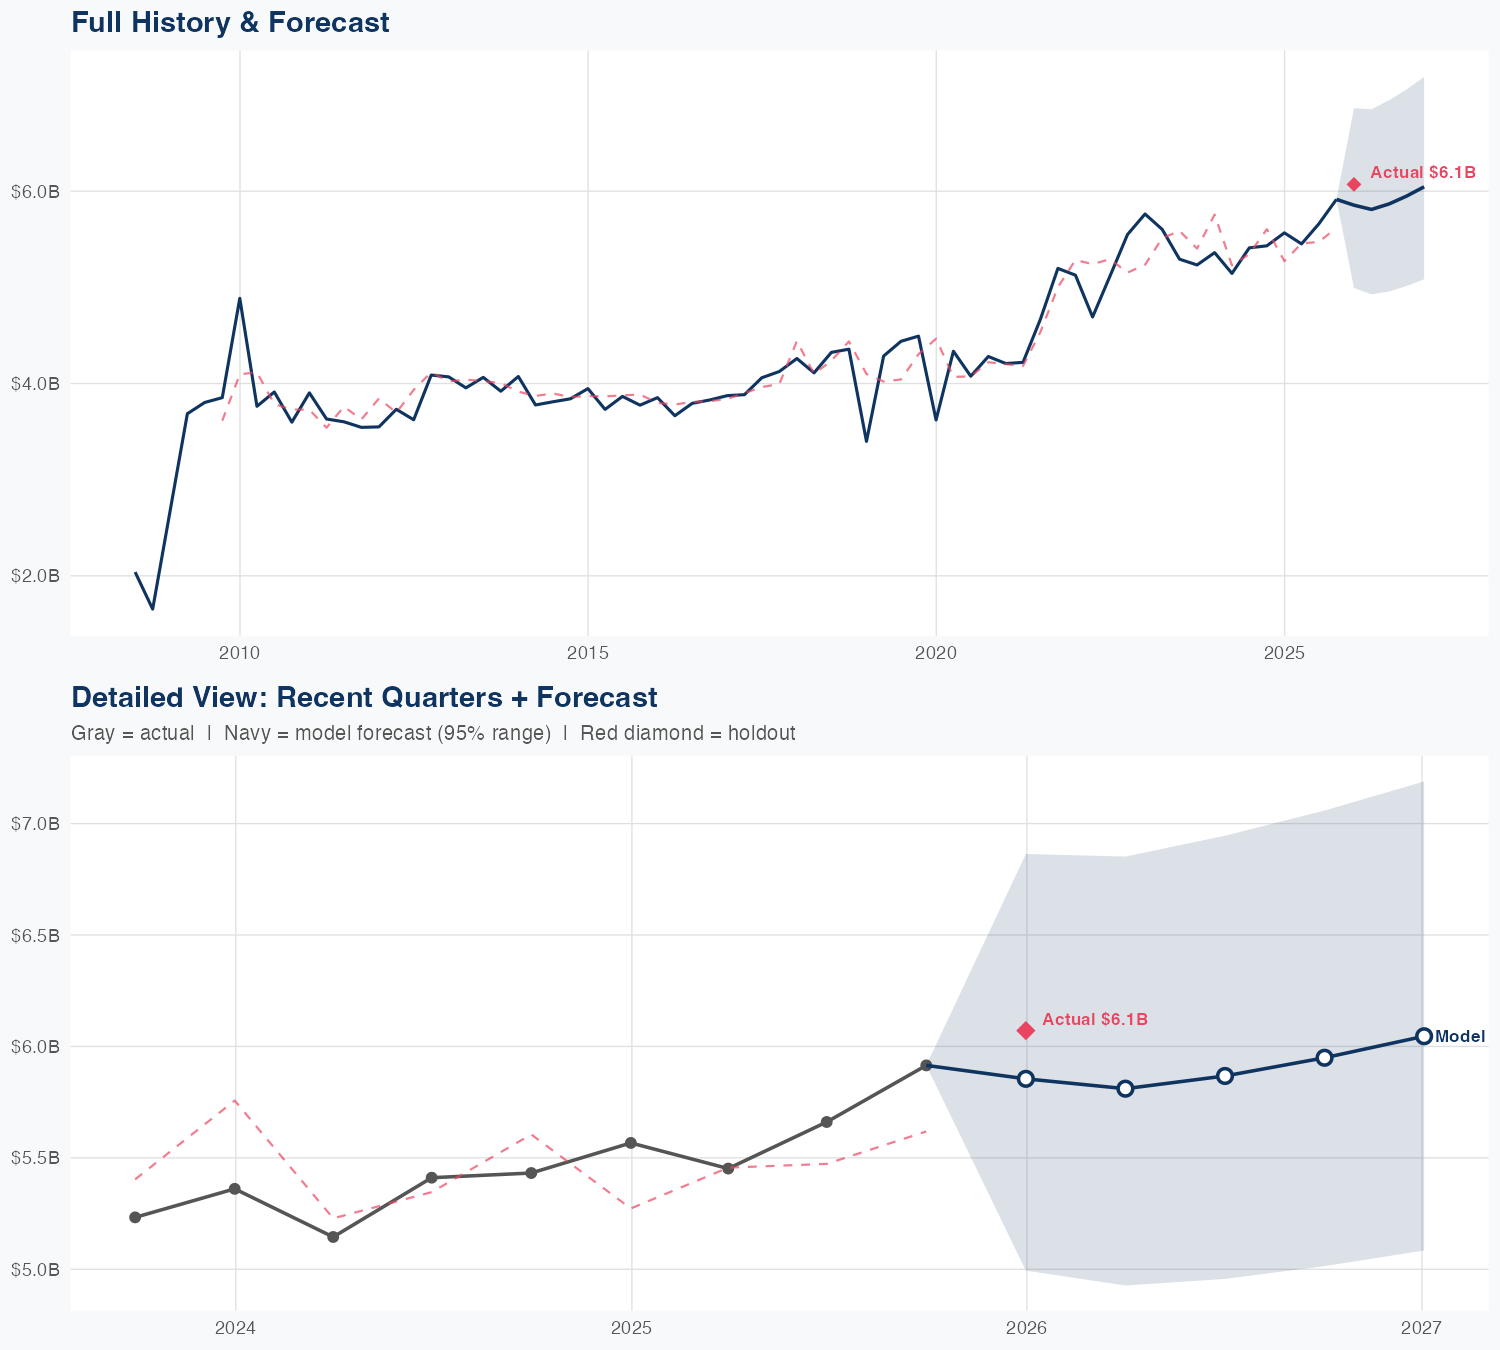
Quarterly Detail
| Quarter | Model Forecast | Actual | 95% Range | YoY Growth | Status |
|---|---|---|---|---|---|
| Q4 2025 | $5.9B | $6.1B | $5.0B – $6.9B | +5.2% | ✓ In range |
| Q2 2026 | $5.8B | $4.9B – $6.9B | +6.6% | ||
| Q3 2026 | $5.9B | $5.0B – $6.9B | +3.6% | ||
| Q4 2026 | $5.9B | $5.0B – $7.1B | +0.6% | ||
| Q1 2027 | $6.0B | $5.1B – $7.2B | -0.4% |
Seasonal Factors
| Fiscal Quarter | Seasonal Factor | vs Trend | Interpretation | Obs. |
|---|---|---|---|---|
| FQ1 (Sep–Nov) | 0.9954 | -0.5% | In line with trend | 17 |
| FQ2 (Dec–Feb) | 1.0117 | +1.2% | In line with trend | 17 |
| FQ3 (Mar–May) | 0.9992 | -0.1% | In line with trend | 16 |
| FQ4 (Jun–Aug) | 1.0096 | +1.0% | In line with trend | 16 |
How Spending Drives Revenue
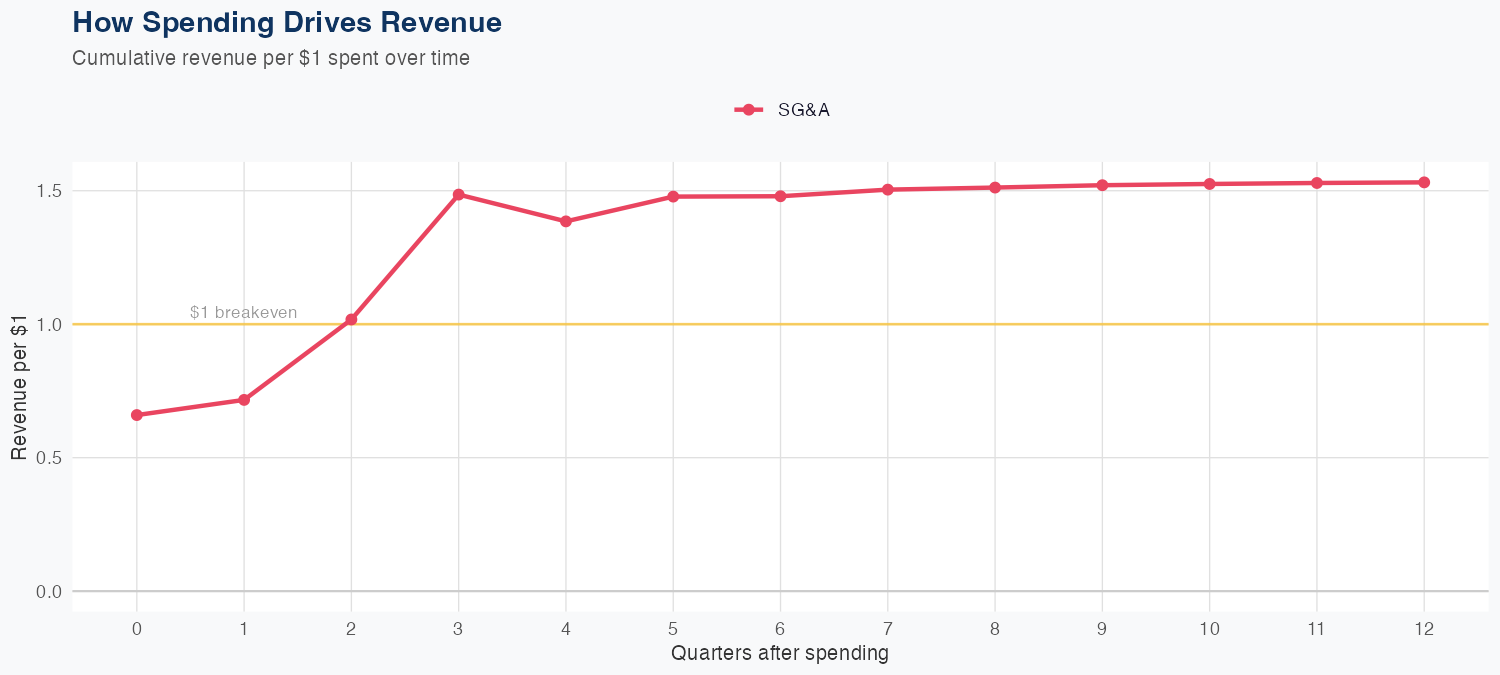
Spending Efficiency Over Time
Current SG&A multiplier: 0.2008
Want this analysis for your portfolio?
I build custom revenue intelligence reports for investors and companies using SEC filing data, econometric modeling, and AI-powered insights.
Get in Touch