Public Storage PSA
Revenue Intelligence Report • 70 quarters of SEC filing data • Updated 2026-03-15
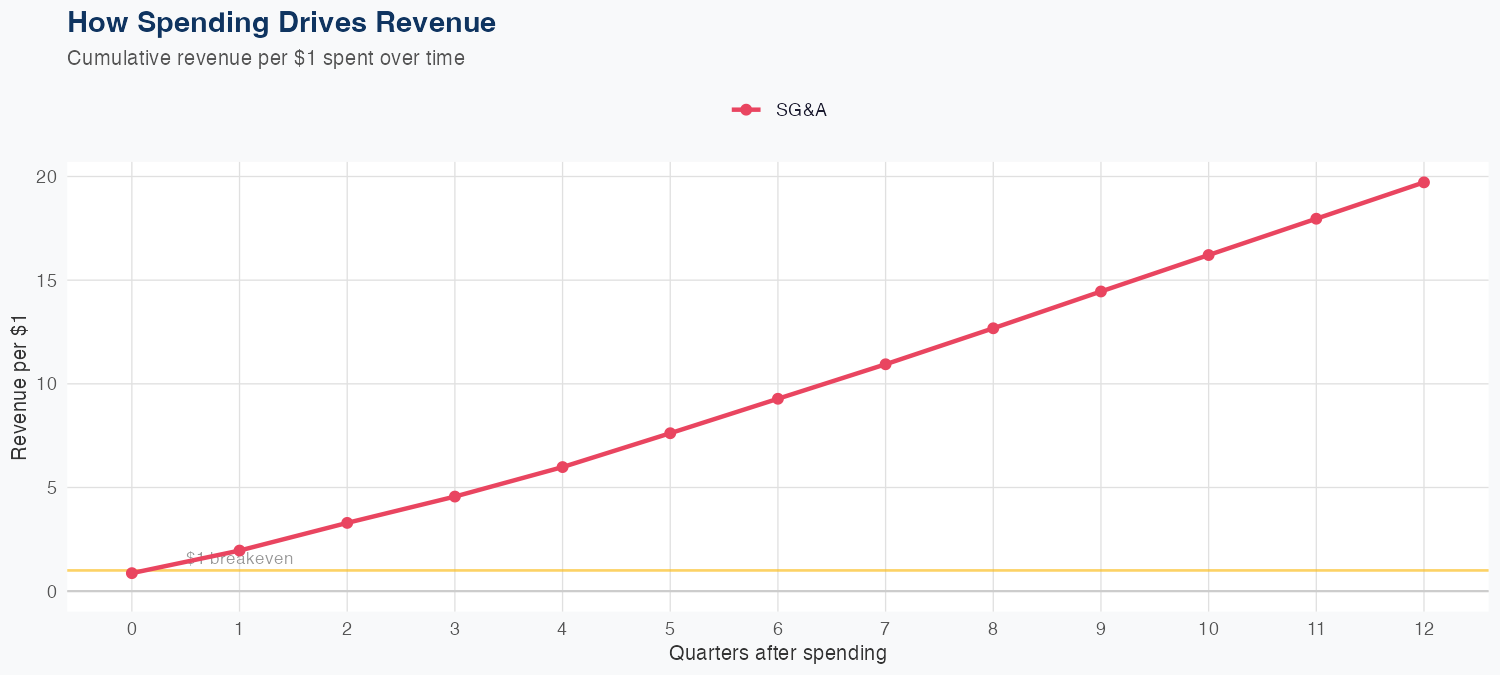
Revenue is driven by a high-leverage SG&A spend, with roughly $19.72 of long-run revenue generated per $1 of SG&A, signaling strong ROI from sales and marketing investments. The model is linear and supported by 70 quarters of data, delivering 1.7% MAPE accuracy, and a holdout test where the forecast was $1.2B and actual was $1.2B (−2.1% error), underscoring forecast reliability. Latest quarterly revenue is $1.216B, with a full-year forecast of $5.2B, representing about 7% year-over-year growth. The outlook points to continued growth through scalable demand in storage and disciplined SG&A efficiency, offering investors a stable ROI on spending and a constructive growth trajectory.
Investment Thesis
Our ARDL model tracks Public Storage's revenue with exceptional precision (1.7% MAPE), indicating highly predictable cash flows. Each $1 of SG&A spending generates $19.72 in revenue, reflecting strong commercial efficiency.
Revenue Forecast
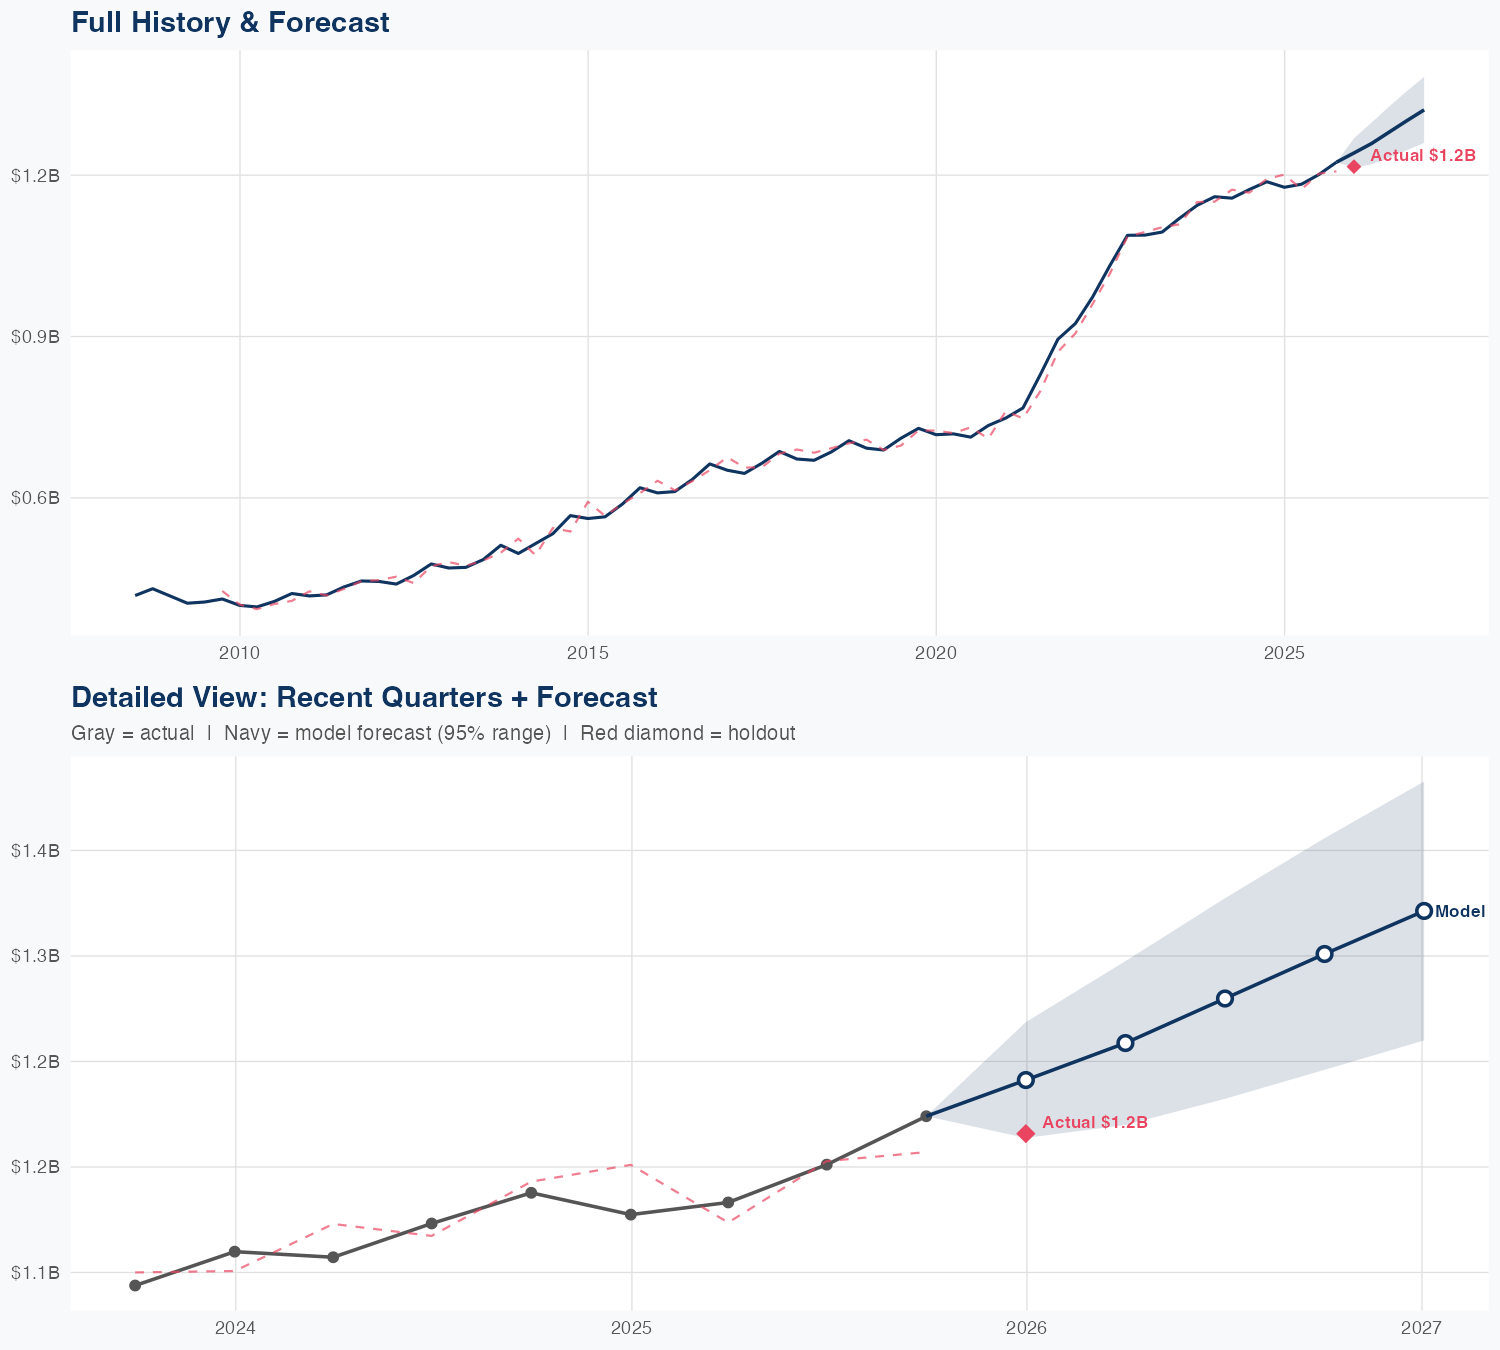
Quarterly Detail
| Quarter | Model Forecast | Actual | 95% Range | YoY Growth | Status |
|---|---|---|---|---|---|
| Q4 2025 | $1.2B | $1.2B | $1.2B – $1.3B | +5.4% | ✓ In range |
| Q2 2026 | $1.3B | $1.2B – $1.3B | +6.4% | ||
| Q3 2026 | $1.3B | $1.2B – $1.3B | +6.6% | ||
| Q4 2026 | $1.3B | $1.2B – $1.4B | +6.3% | ||
| Q1 2027 | $1.3B | $1.3B – $1.4B | +8.7% |
Seasonal Factors
| Fiscal Quarter | Seasonal Factor | vs Trend | Interpretation | Obs. |
|---|---|---|---|---|
| FQ1 (Sep–Nov) | 1.009 | +0.9% | In line with trend | 17 |
| FQ2 (Dec–Feb) | 0.9804 | -2.0% | In line with trend | 17 |
| FQ3 (Mar–May) | 0.9981 | -0.2% | In line with trend | 16 |
| FQ4 (Jun–Aug) | 1.0085 | +0.8% | In line with trend | 16 |
How Spending Drives Revenue
Want this analysis for your portfolio?
I build custom revenue intelligence reports for investors and companies using SEC filing data, econometric modeling, and AI-powered insights.
Get in Touch