Regions Financial Corporation RF
Revenue Intelligence Report • 70 quarters of SEC filing data • Updated 2026-03-15
RF’s revenue is projected to grow a modest 0.5% year over year, with the lift coming more from structural/platform expansion than from loan growth alone. In our econometric model, revenue growth is attributed roughly one-third to structural/platform gains and two-thirds to SG&A spend, with R&D contributing essentially zero. Time-varying analysis shows the SG&A multiplier rising from near zero to about 0.27, implying incremental SG&A spend is increasingly effective at driving topline growth. The binding constraint on upside is SG&A investment capacity—the firm’s ability to allocate and approve additional marketing/sales spend. Key risk: a softer macro environment or higher credit costs could dampen loan demand and fee income, offsetting the upside from SG&A-driven growth.
Investment Thesis
Our ARDL model tracks Regions Financial Corporation's revenue with exceptional precision (2.0% MAPE), indicating highly predictable cash flows. Each $1 of SG&A spending generates $0.19 in revenue, reflecting strong commercial efficiency.
Revenue Forecast
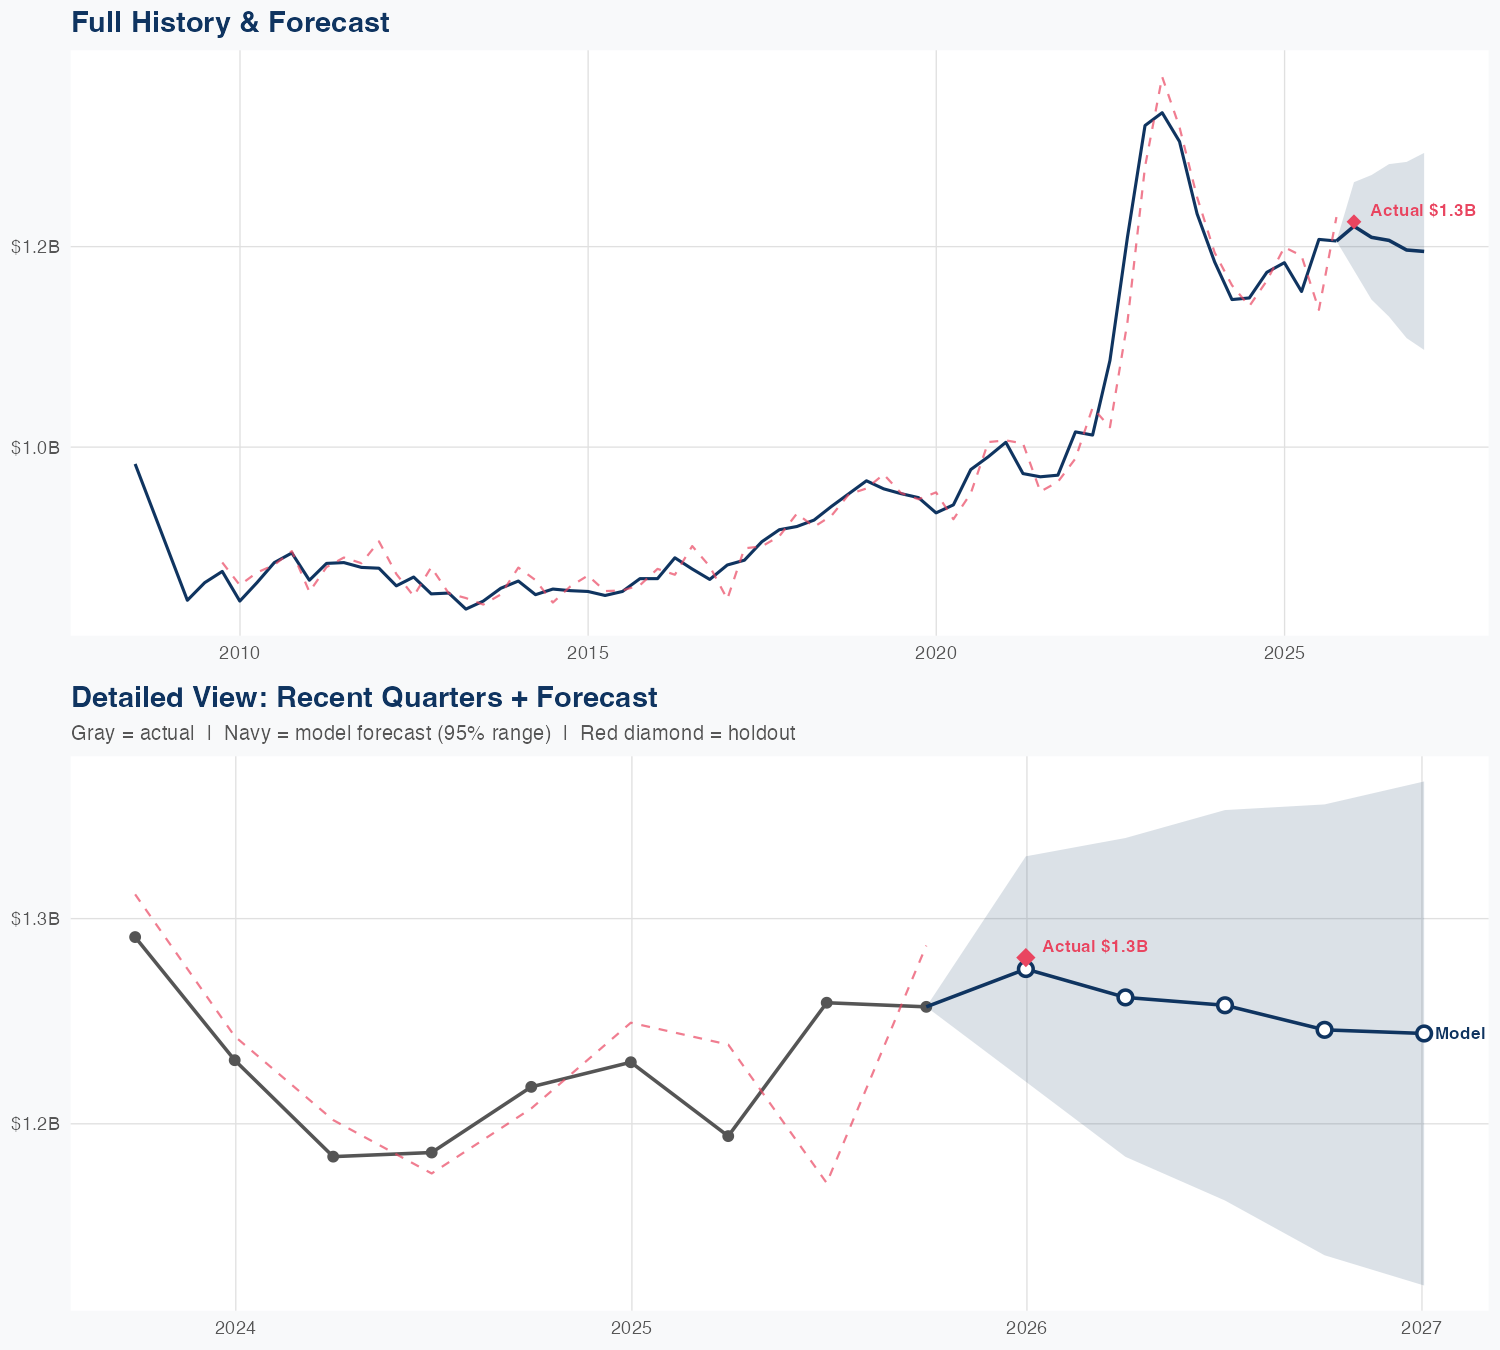
Quarterly Detail
| Quarter | Model Forecast | Actual | 95% Range | YoY Growth | Status |
|---|---|---|---|---|---|
| Q4 2025 | $1.3B | $1.3B | $1.2B – $1.3B | +3.5% | ✓ In range |
| Q2 2026 | $1.3B | $1.2B – $1.3B | +5.4% | ||
| Q3 2026 | $1.3B | $1.2B – $1.4B | -0.2% | ||
| Q4 2026 | $1.2B | $1.1B – $1.4B | -0.6% | ||
| Q1 2027 | $1.3B | $1.1B – $1.4B | -2.2% |
Seasonal Factors
| Fiscal Quarter | Seasonal Factor | vs Trend | Interpretation | Obs. |
|---|---|---|---|---|
| FQ1 (Sep–Nov) | 0.9973 | -0.3% | In line with trend | 17 |
| FQ2 (Dec–Feb) | 0.9906 | -0.9% | In line with trend | 17 |
| FQ3 (Mar–May) | 0.983 | -1.7% | In line with trend | 16 |
| FQ4 (Jun–Aug) | 1.0087 | +0.9% | In line with trend | 16 |
How Spending Drives Revenue
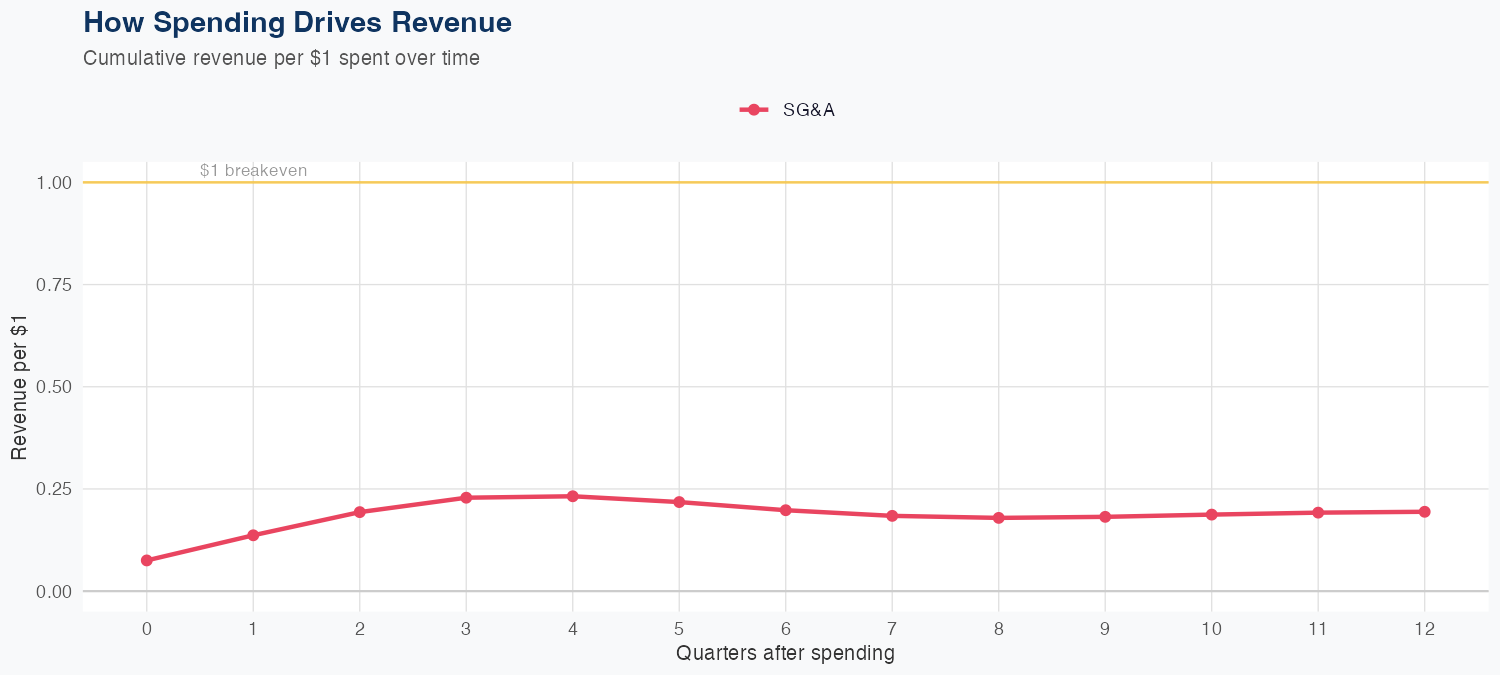
Spending Efficiency Over Time
Current SG&A multiplier: 0.2689
Want this analysis for your portfolio?
I build custom revenue intelligence reports for investors and companies using SEC filing data, econometric modeling, and AI-powered insights.
Get in Touch