Raymond James Financial, Inc. RJF
Revenue Intelligence Report • 50 quarters of SEC filing data • Updated 2026-03-15
Revenue is forecast to grow about 18% year over year to roughly $19 billion, with the pace supported by a durable structural/platform engine and favorable pricing dynamics. In our econometric model, structural/platform growth accounts for about 23% of the expansion, while SG&A-driven activity contributes about 77%, with R&D contribution negligible. SG&A elasticity has trended lower, moving from near 1x to about 0.6x, signaling increasing operating leverage and that much of the revenue lift comes from platform scale and pricing power rather than incremental spending. Binding constraint on growth: delivery capacity of the advisor network and related operations to absorb higher client assets and volumes. Key risk: if advisor and back-office capacity cannot scale with demand, the growth trajectory could decelerate, with potential headwinds from regulatory changes or market downturns.
Investment Thesis
Our ARDL model tracks Raymond James Financial, Inc.'s revenue with exceptional precision (2.5% MAPE), indicating highly predictable cash flows. Sales & marketing spend shows a 1.12x elasticity, suggesting effective go-to-market execution.
Revenue Forecast
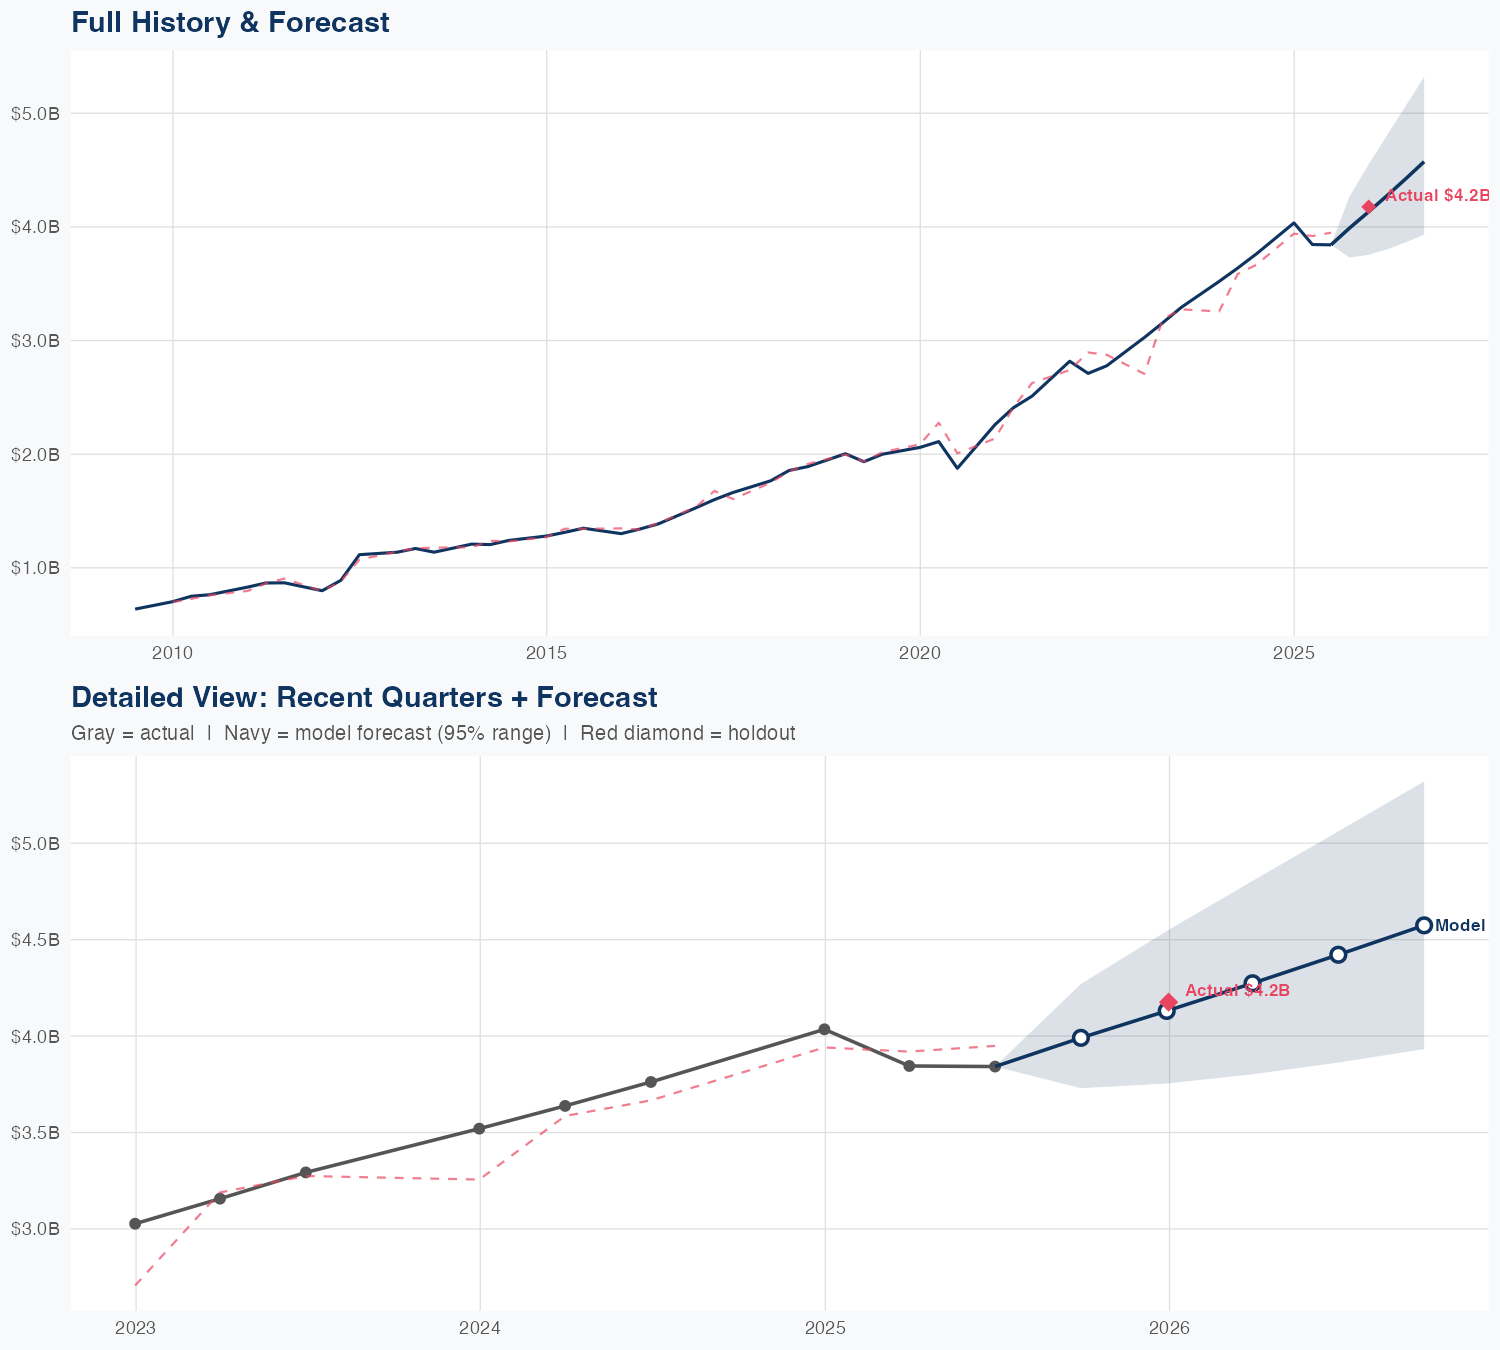
Quarterly Detail
| Quarter | Model Forecast | Actual | 95% Range | YoY Growth | Status |
|---|---|---|---|---|---|
| Q3 2025 | $4.3B | $4.2B | $4.0B – $4.7B | +14.6% | ✓ In range |
| Q4 2025 | $4.5B | $4.1B – $5.0B | +12.3% | ||
| Q1 2026 | $4.6B | $4.2B – $5.0B | +18.5% | ||
| Q2 2026 | $4.7B | $4.3B – $5.2B | +23.4% | ||
| Q3 2026 | $5.0B | $4.5B – $5.6B | +19.7% |
Seasonal Factors
| Fiscal Quarter | Seasonal Factor | vs Trend | Interpretation | Obs. |
|---|---|---|---|---|
| FQ1 (Sep–Nov) | 1.0 | +0.0% | In line with trend | 0 |
| FQ2 (Dec–Feb) | 1.0094 | +0.9% | In line with trend | 17 |
| FQ3 (Mar–May) | 0.9993 | -0.1% | In line with trend | 16 |
| FQ4 (Jun–Aug) | 0.9953 | -0.5% | In line with trend | 16 |
How Spending Drives Revenue
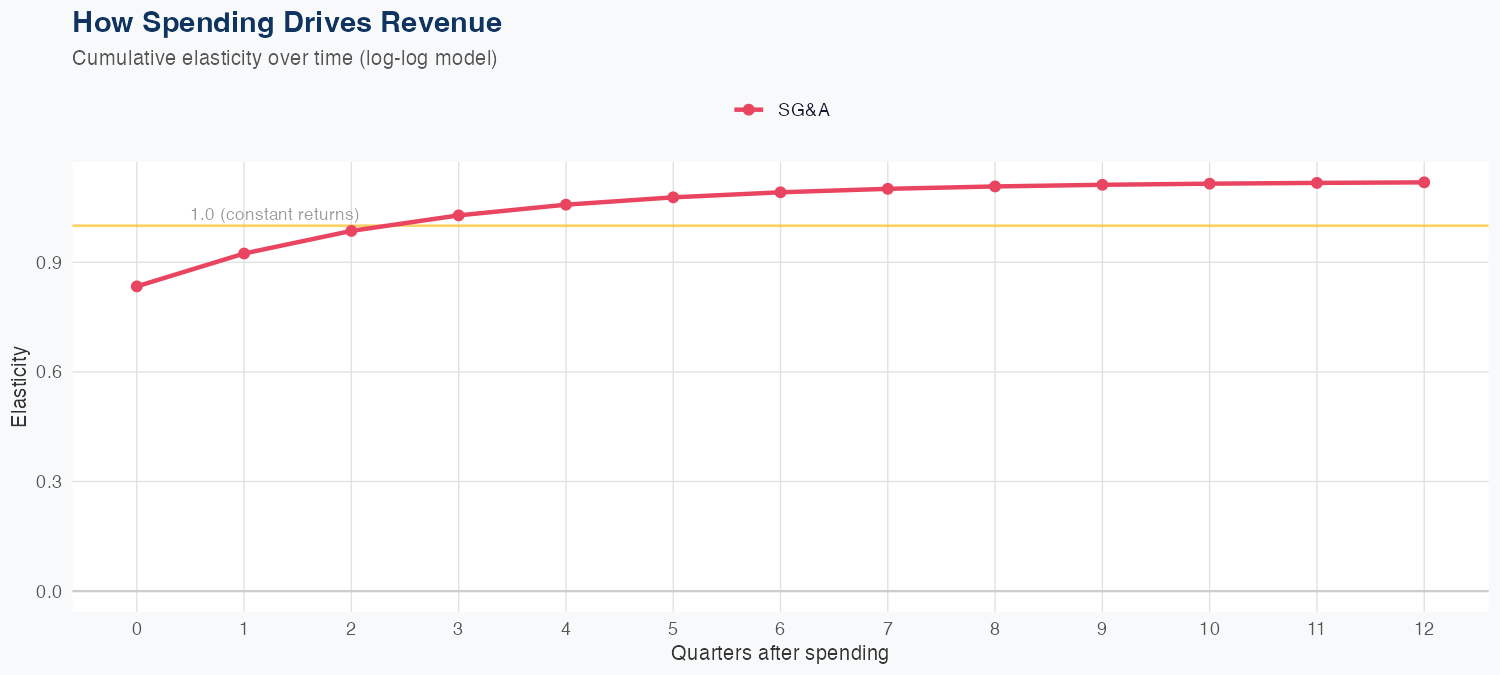
Spending Efficiency Over Time
Current SG&A elasticity: 0.6173x
Want this analysis for your portfolio?
I build custom revenue intelligence reports for investors and companies using SEC filing data, econometric modeling, and AI-powered insights.
Get in Touch