Rocket Lab Corporation RKLB
Revenue Intelligence Report • 21 quarters of SEC filing data • Updated 2026-03-15
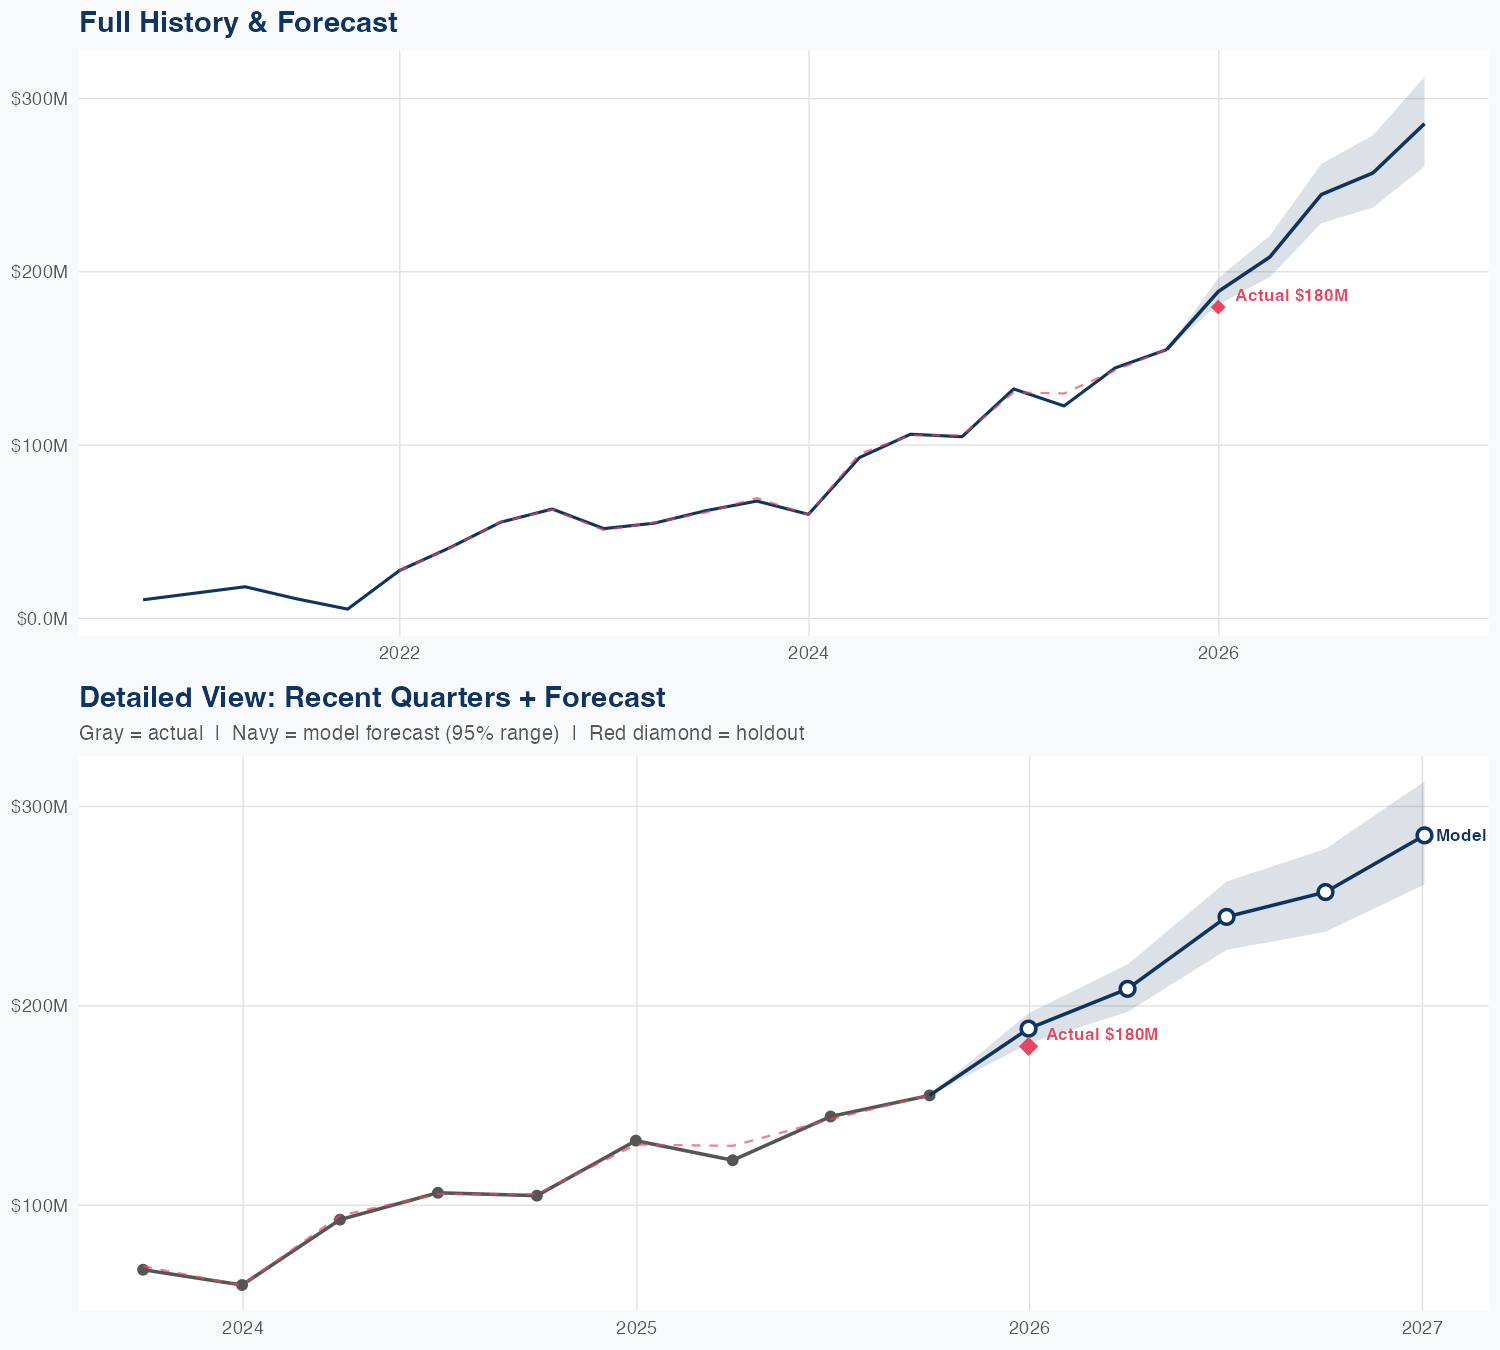
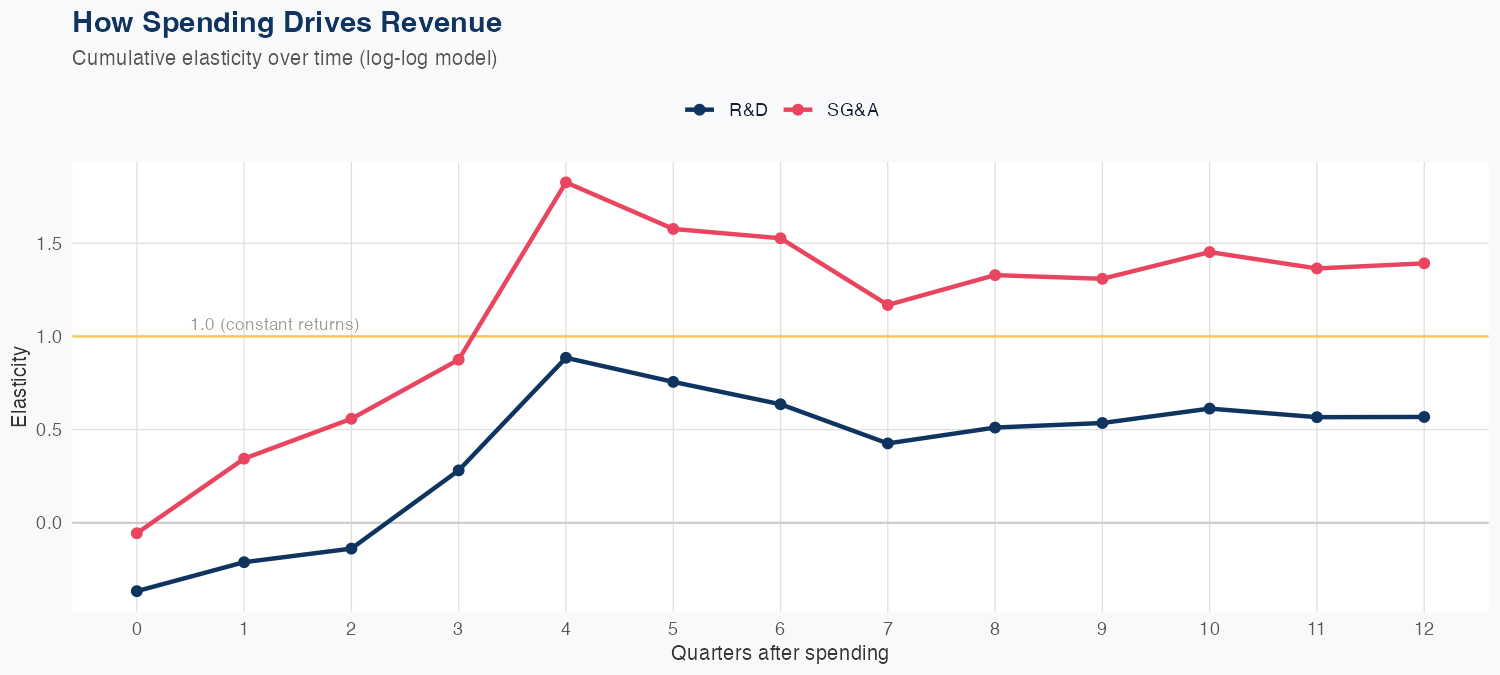
For RKLB, revenue growth is driven primarily by SG&A investments, with a 1% rise in SG&A yielding a 1.39% increase in revenue, while R&D contributes a smaller 0.57% per 1% spend. This implies SG&A spending provides a higher revenue ROI than R&D within the model, suggesting near-term emphasis on go-to-market efficiency and selling, general, and administrative activities. The model is reasonably accurate (MAPE 1.4%), but a holdout test showed a 5% miss in the latest quarter, predicting $189M versus actual $180M, indicating some quarterly volatility. The outlook remains strong, with a forecasted revenue of $996M for the year, up 65.5% year over year, though investors should monitor changes in spend mix and margin dynamics as growth accelerates.
Investment Thesis
Our ARDL model tracks Rocket Lab Corporation's revenue with exceptional precision (1.4% MAPE), indicating highly predictable cash flows. R&D investment shows a 0.57x multiplier — each 1% increase in R&D spend is associated with a 0.57% revenue increase, signaling strong innovation-to-revenue conversion. Sales & marketing spend shows a 1.39x elasticity, suggesting effective go-to-market execution.
Revenue Forecast
Quarterly Detail
| Quarter | Model Forecast | Actual | 95% Range | YoY Growth | Status |
|---|---|---|---|---|---|
| Q4 2025 | $189M | $180M | $181M – $196M | +42.4% | ✗ Outside range |
| Q2 2026 | $209M | $197M – $221M | +70.1% | ||
| Q3 2026 | $245M | $228M – $262M | +69.3% | ||
| Q4 2026 | $257M | $237M – $279M | +65.8% | ||
| Q1 2027 | $286M | $261M – $313M | +58.9% |
Seasonal Factors
| Fiscal Quarter | Seasonal Factor | vs Trend | Interpretation | Obs. |
|---|---|---|---|---|
| FQ1 (Sep–Nov) | 0.9993 | -0.1% | In line with trend | 4 |
| FQ2 (Dec–Feb) | 1.0153 | +1.5% | In line with trend | 5 |
| FQ3 (Mar–May) | 0.9939 | -0.6% | In line with trend | 4 |
| FQ4 (Jun–Aug) | 1.0096 | +1.0% | In line with trend | 4 |
How Spending Drives Revenue
Want this analysis for your portfolio?
I build custom revenue intelligence reports for investors and companies using SEC filing data, econometric modeling, and AI-powered insights.
Get in Touch