Rocket Companies, Inc. RKT
Revenue Intelligence Report • 26 quarters of SEC filing data • Updated 2026-03-15
Revenue is expected to grow roughly 60% year over year, taking Rocket to about $320 million next year as the business continues to scale and leverage platform momentum. According to our econometric model, structural/platform growth accounts for about 48% of the lift while SG&A spending contributes the remaining 52%; SG&A elasticity has risen, meaning incremental spend translates into outsized topline gains. The binding constraint on growth is the ability to scale loan origination capacity—funding, processing, and fulfillment—to absorb higher SG&A spend. Key risk: a deceleration in mortgage demand or bottlenecks in scaling origination operations could cap upside, even with strong spend efficiency.
Investment Thesis
At 31.8% MAPE, the model captures Rocket Companies, Inc.'s broad revenue trajectory, though quarterly variability suggests sensitivity to external factors. Sales & marketing spend shows a 1.61x elasticity, suggesting effective go-to-market execution.
Revenue Forecast
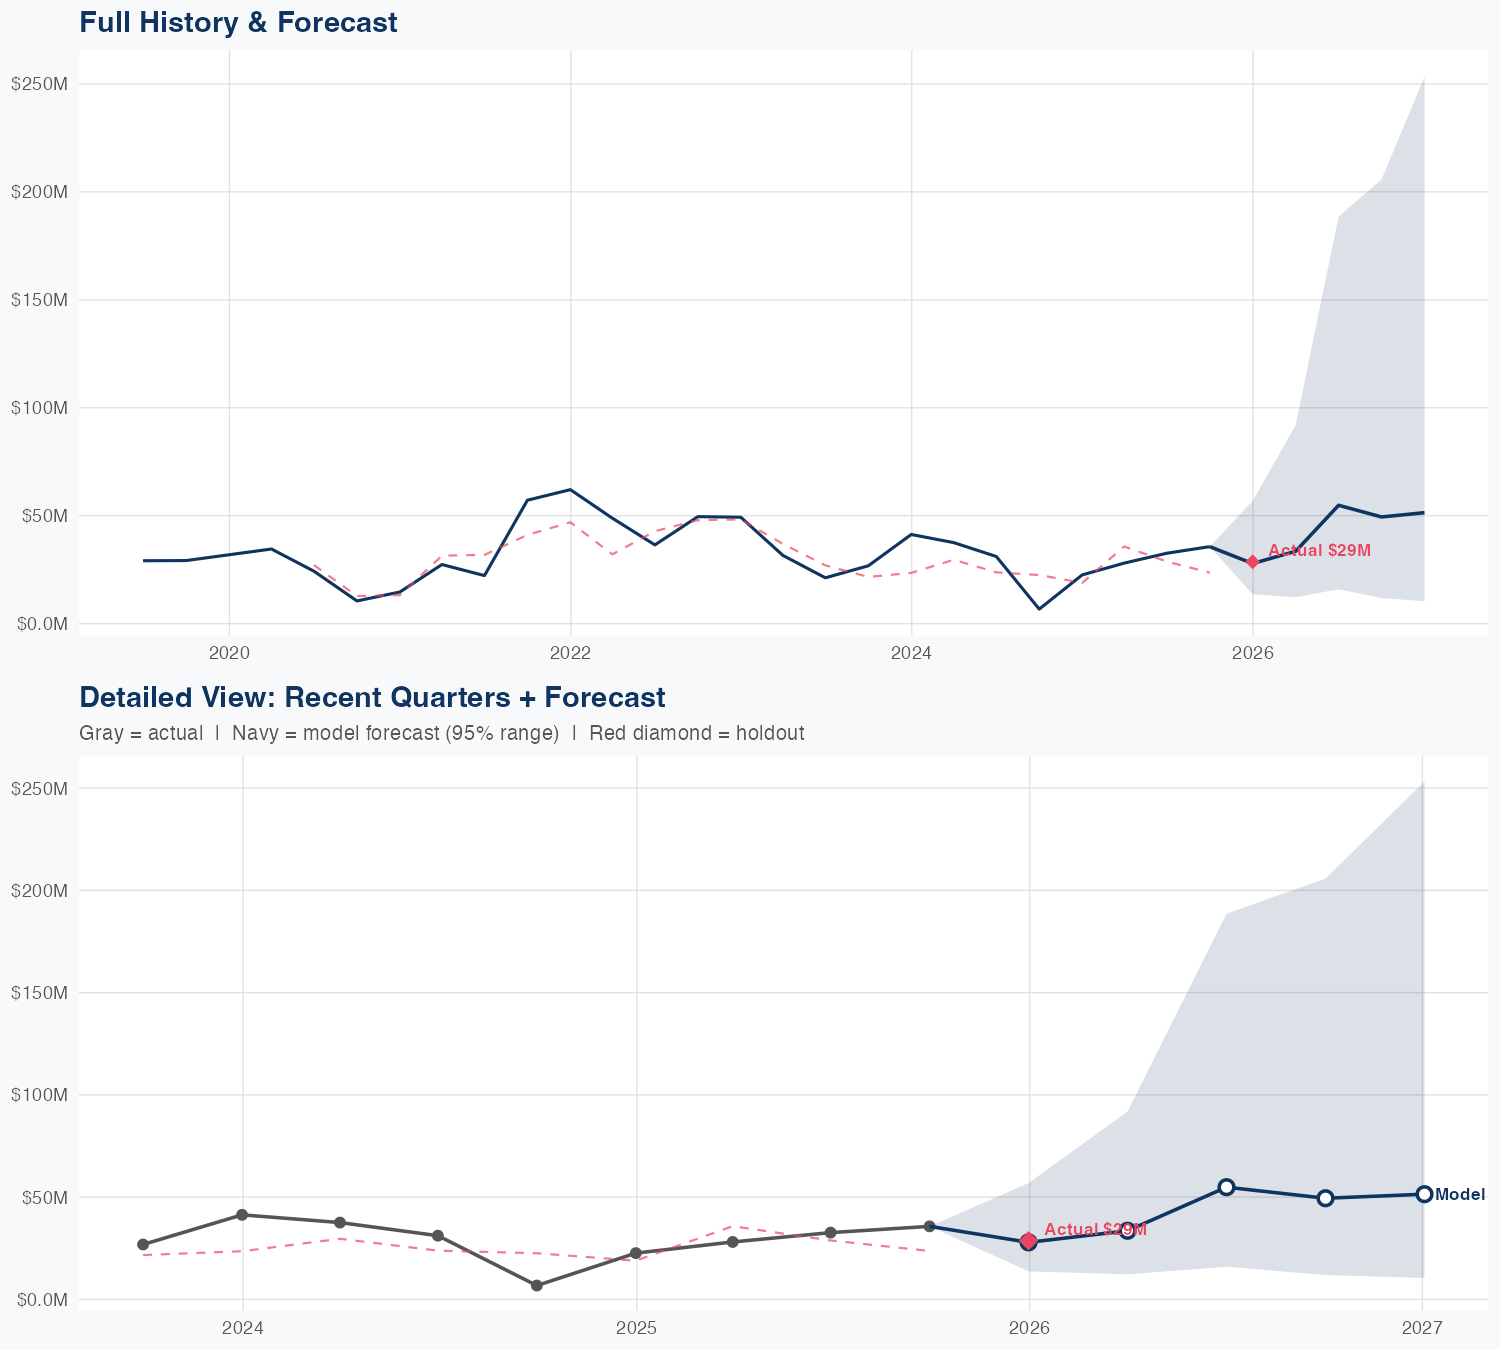
Quarterly Detail
| Quarter | Model Forecast | Actual | 95% Range | YoY Growth | Status |
|---|---|---|---|---|---|
| Q4 2025 | $23M | $29M | $11M – $46M | +0.6% | ✓ In range |
| Q2 2026 | $40M | $15M – $111M | +44.4% | ||
| Q3 2026 | $69M | $20M – $236M | +110.4% | ||
| Q4 2026 | $37M | $8.9M – $154M | +3.9% | ||
| Q1 2027 | $54M | $11M – $265M | +87.7% |
Seasonal Factors
| Fiscal Quarter | Seasonal Factor | vs Trend | Interpretation | Obs. |
|---|---|---|---|---|
| FQ1 (Sep–Nov) | 1.2381 | +23.8% | +23.8% above trend | 6 |
| FQ2 (Dec–Feb) | 1.1949 | +19.5% | +19.5% above trend | 6 |
| FQ3 (Mar–May) | 0.87 | -13.0% | -13.0% below trend | 5 |
| FQ4 (Jun–Aug) | 0.8958 | -10.4% | -10.4% below trend | 6 |
How Spending Drives Revenue
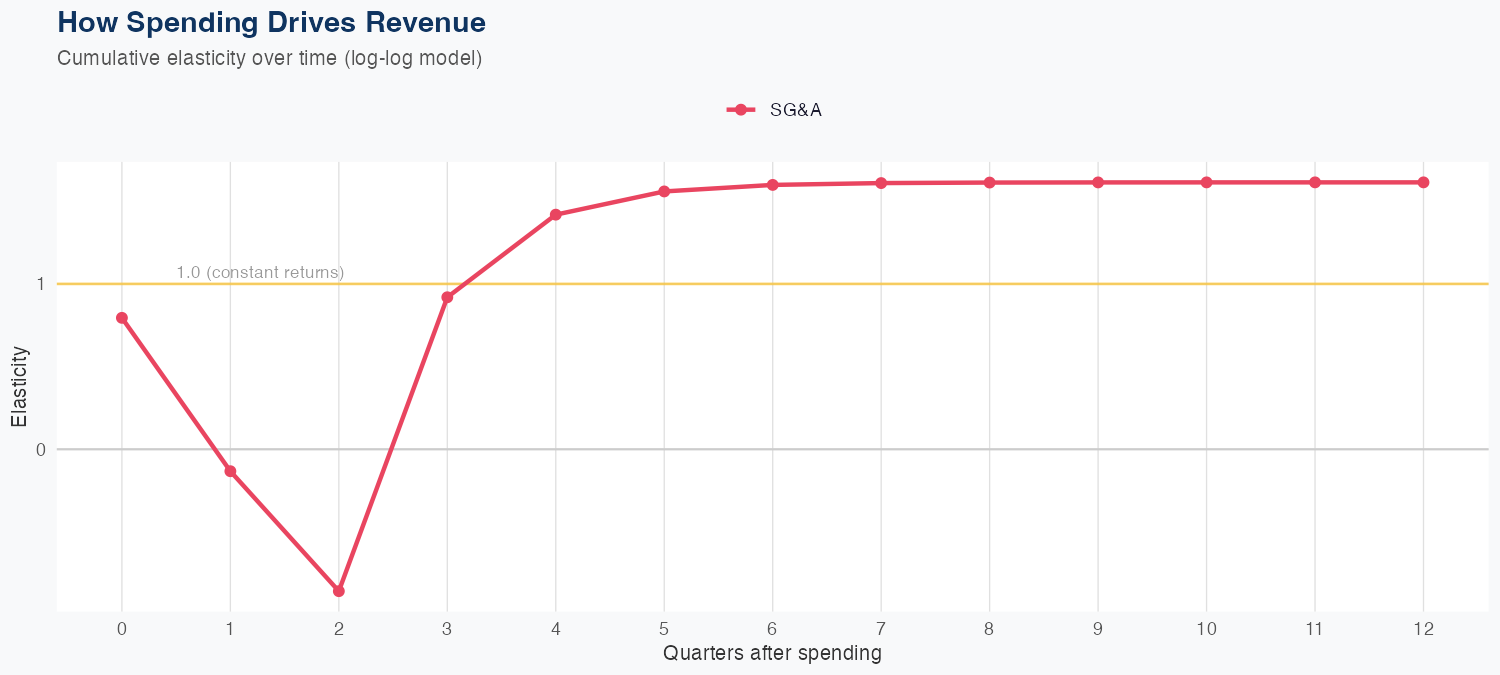
Spending Efficiency Over Time
Current SG&A elasticity: 1.4725x
Want this analysis for your portfolio?
I build custom revenue intelligence reports for investors and companies using SEC filing data, econometric modeling, and AI-powered insights.
Get in Touch