Rockwell Automation, Inc ROK
Revenue Intelligence Report • 2 quarters of SEC filing data • Updated 2026-03-16
Rockwell Automation's revenue outlook is flat to modestly higher near term, roughly $11.1 billion this year, with gains coming mainly from SG&A investments rather than a meaningful uptick in core platform demand. Binding constraint: our econometric model points to delivery capacity to execute and install automation projects as the key bottleneck for further growth. Our model shows SG&A spending is the growth lever—elasticity is high and rising—while structural growth remains essentially flat. Key risk: if delivery capacity cannot scale with demand or if end-market capex slows, upside from SG&A-driven growth could falter, with cyclicality in industrial automation remaining a macro overhang.
Investment Thesis
Our ARDL model tracks Rockwell Automation, Inc's revenue with exceptional precision (0.0% MAPE), indicating highly predictable cash flows.
Revenue Forecast
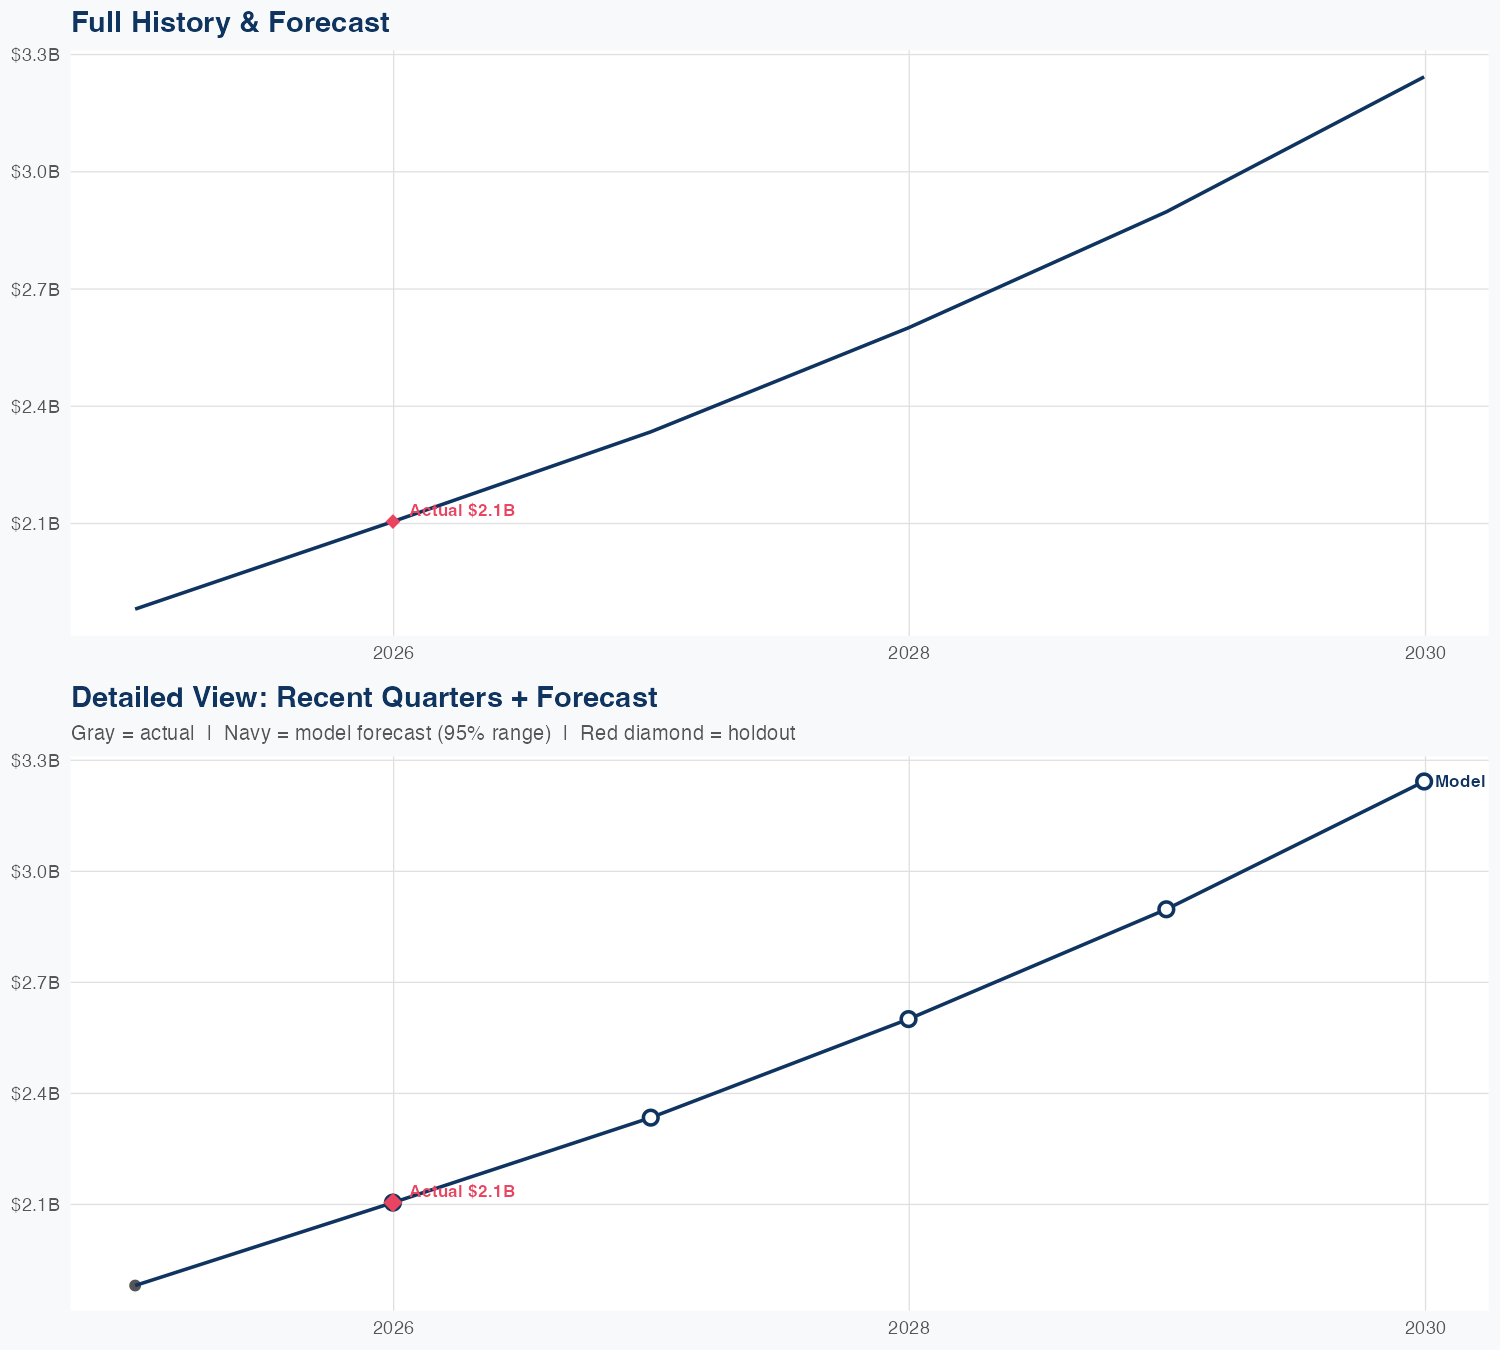
Quarterly Detail
| Quarter | Model Forecast | Actual | 95% Range | YoY Growth | Status |
|---|---|---|---|---|---|
| Q4 2025 | $2.1B | $2.1B | $2.1B – $2.1B | ✓ In range | |
| Q4 2026 | $2.3B | $2.3B – $2.3B | |||
| Q4 2027 | $2.6B | $2.6B – $2.6B | |||
| Q4 2028 | $2.9B | $2.9B – $2.9B | +54.0% | ||
| Q4 2029 | $3.2B | $3.2B – $3.2B | +54.1% |
How Spending Drives Revenue

Spending Efficiency Over Time
Current SG&A elasticity: 1.0742x
Want this analysis for your portfolio?
I build custom revenue intelligence reports for investors and companies using SEC filing data, econometric modeling, and AI-powered insights.
Get in Touch