Echostar Corporation SATS
Revenue Intelligence Report • 66 quarters of SEC filing data • Updated 2026-03-15
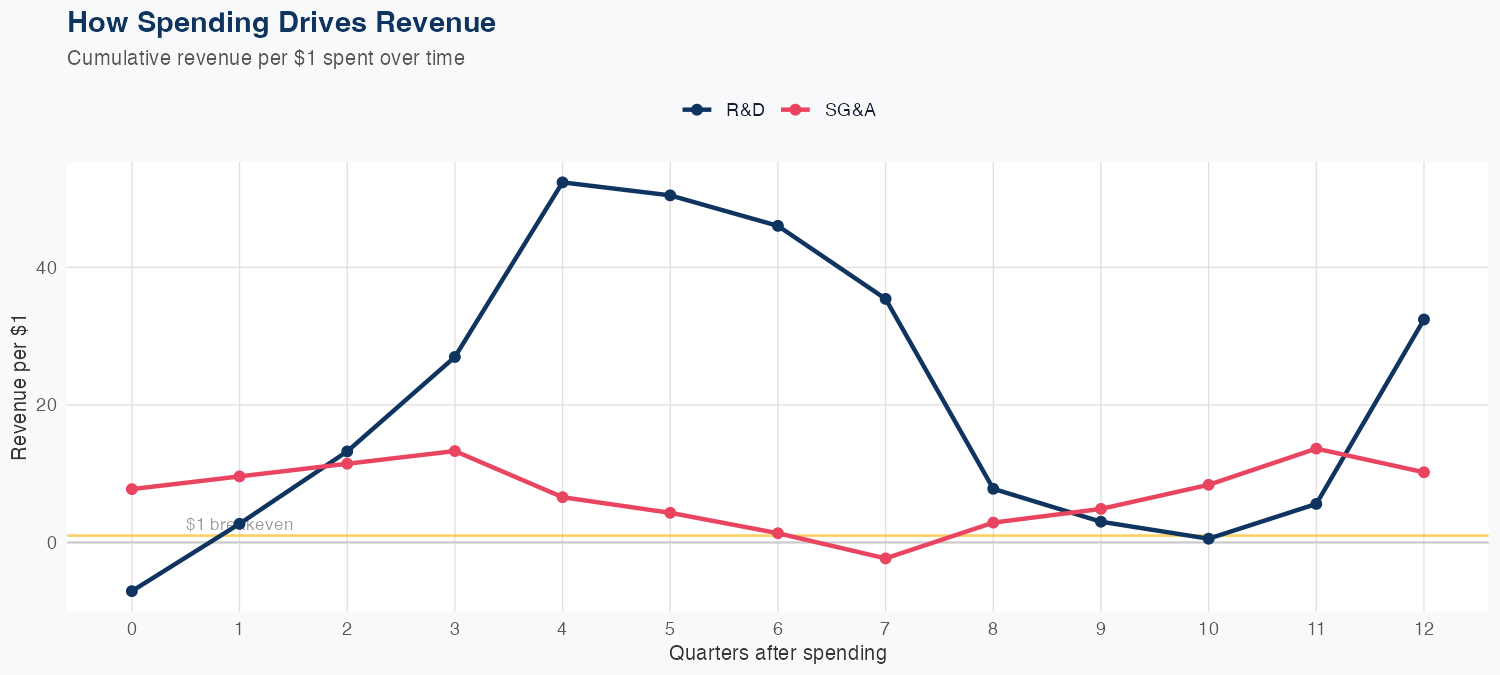
The model indicates revenue drivers from spend, with each $1 of R&D associated with $32.41 of long-run revenue and each $1 of SG&A associated with $10.20, based on 66 quarters of data using a linear framework. The model’s accuracy is limited (MAPE 30.5%), and a holdout test showed predicted $2.9B versus actual $3.8B, a 24% error, signaling near-term forecast unreliability. The FY forecast implies about $10B in revenue, down 32.9% year over year, indicating meaningful near-term headwinds despite the favorable long-run spend signals. Investors should weigh the strong implied ROI on R&D against near-term forecast risk and model uncertainty, focusing on spend efficiency to realize the long-run revenue potential.
Investment Thesis
At 30.5% MAPE, the model captures Echostar Corporation's broad revenue trajectory, though quarterly variability suggests sensitivity to external factors. Every $1 of R&D investment is associated with $32.41 of revenue, indicating efficient capital deployment in innovation. Each $1 of SG&A spending generates $10.20 in revenue, reflecting strong commercial efficiency.
Revenue Forecast
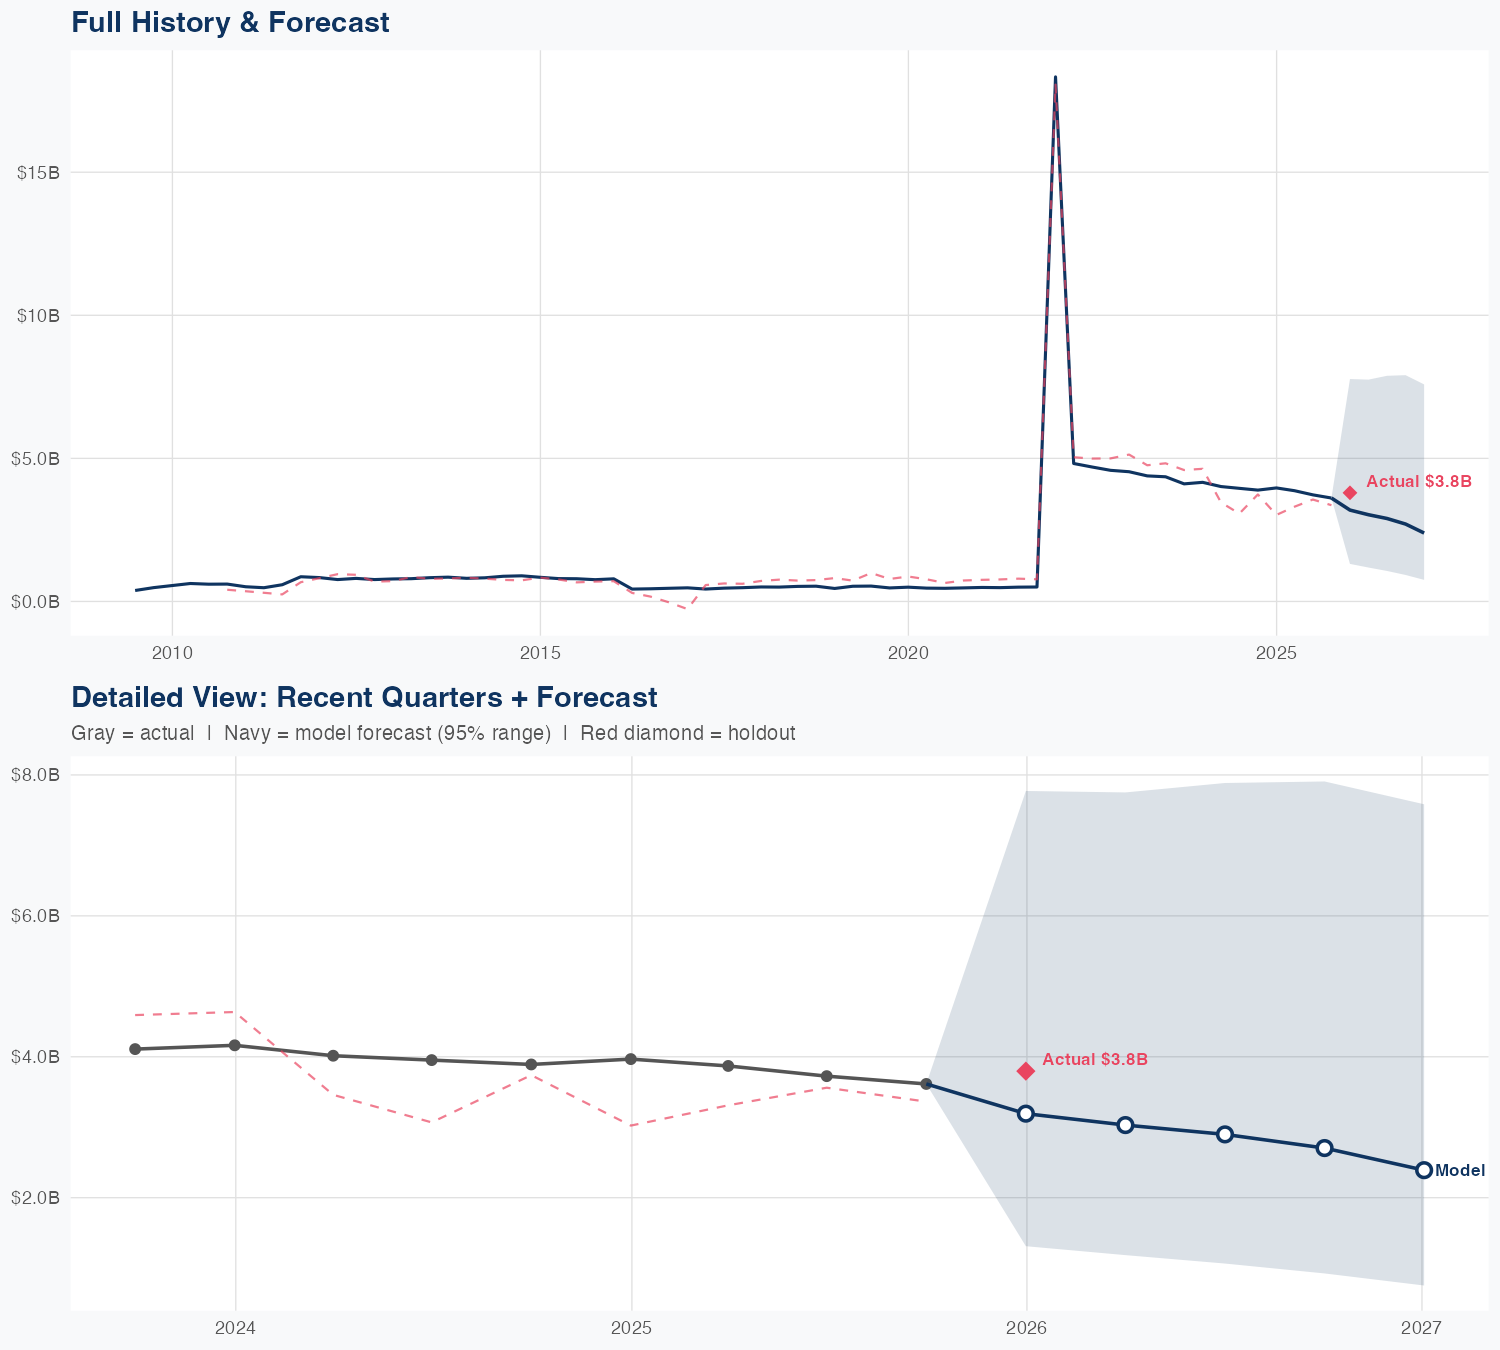
Quarterly Detail
| Quarter | Model Forecast | Actual | 95% Range | YoY Growth | Status |
|---|---|---|---|---|---|
| Q4 2025 | $2.9B | $3.8B | $2.2B – $3.6B | -27.2% | ✗ Outside range |
| Q2 2026 | $2.7B | $1.7B – $3.7B | -31.1% | ||
| Q3 2026 | $2.5B | $1.2B – $3.7B | -33.6% | ||
| Q4 2026 | $2.3B | $0.8B – $3.7B | -37.4% | ||
| Q1 2027 | $2.7B | $1.1B – $4.3B | -29.5% |
Seasonal Factors
| Fiscal Quarter | Seasonal Factor | vs Trend | Interpretation | Obs. |
|---|---|---|---|---|
| FQ1 (Sep–Nov) | 1.0405 | +4.1% | +4.1% above trend | 15 |
| FQ2 (Dec–Feb) | 1.0127 | +1.3% | In line with trend | 15 |
| FQ3 (Mar–May) | 0.931 | -6.9% | -6.9% below trend | 15 |
| FQ4 (Jun–Aug) | 0.9412 | -5.9% | -5.9% below trend | 15 |
How Spending Drives Revenue
Want this analysis for your portfolio?
I build custom revenue intelligence reports for investors and companies using SEC filing data, econometric modeling, and AI-powered insights.
Get in Touch