NASDAQ · SFM | November 20, 2026 | Actuals through September 27
Sprouts Farmers Market
The model and management’s outlook both put fiscal Q4 sales near $2.42 billion. The historical relationship between sales, gross margin and expenses produces $1.06 of diluted EPS, with an 80% predictive interval of $0.78–$1.35. Sprouts’ outlook implies about $0.63–$0.67 for the same 14 weeks. October earnings release.
In Q3, sales rose 4.7% year over year, while gross profit rose 3.5%. Gross margin fell from 38.7% to 38.2%, and net income fell 5.6%. Share repurchases helped narrow the per-share decline to $1.21 from $1.22. The company cited a food-safety disruption and said it would invest in affordability and customer engagement. Those plans could change both gross margin and spending in Q4. Q3 results and management commentary.
Quarterly forecast
Each estimate is the median of 6,000 simulated income statements. Amounts are in millions of dollars, shares are in millions, and EPS is dollars per diluted share.
| GAAP measure | Q3 ’26 actual | Q4 FY26 | Q1 FY27 | Q2 FY27 | Q3 FY27 |
|---|---|---|---|---|---|
| Net sales | $2,304.7M | $2,421.3M | $2,471.9M | $2,439.7M | $2,435.4M |
| Cost of sales | $1,423.9M | $1,501.7M | $1,504.8M | $1,502.7M | $1,504.8M |
| Gross profit | $880.8M | $919.0M | $968.1M | $936.9M | $932.0M |
| Gross margin | 38.2% | 38.0% | 39.1% | 38.4% | 38.2% |
| Selling, general and administrative | $683.3M | $731.6M | $701.4M | $710.1M | $713.8M |
| Other operating expenses | $44.7M | $52.2M | $47.0M | $46.6M | $48.6M |
| Total operating expenses | $728.0M | $784.2M | $749.1M | $757.2M | $762.8M |
| Operating income | $152.8M | $134.5M | $218.2M | $178.4M | $167.5M |
| Net nonoperating income | $-1.4M | $-1.2M | $-1.4M | $-1.4M | $-1.2M |
| Pretax income | $151.4M | $133.3M | $216.9M | $177.1M | $166.2M |
| Income tax provision | $37.9M | $34.3M | $51.5M | $44.1M | $39.3M |
| Effective tax rate | 25.1% | 25.9% | 23.8% | 24.9% | 23.7% |
| Net income | $113.4M | $98.6M | $165.4M | $132.6M | $126.7M |
| Basic weighted-average shares | 93.13M | 92.53M | 91.60M | 90.80M | 90.07M |
| Diluted weighted-average shares | 93.67M | 93.16M | 92.29M | 91.34M | 90.70M |
| Diluted EPS | $1.21 | $1.06 | $1.79 | $1.45 | $1.40 |
80% and 95% predictive intervals for every line
Q4 FY26 · 2027-01-03
| GAAP measure | Median | 80% interval | 95% interval |
|---|---|---|---|
| Net sales | $2,421.3M | $2,344.3M – $2,499.1M | $2,294.2M – $2,558.9M |
| Cost of sales | $1,501.7M | $1,455.1M – $1,549.1M | $1,425.3M – $1,584.3M |
| Gross profit | $919.0M | $879.6M – $958.8M | $854.2M – $987.6M |
| Gross margin | 38.0% | 37.2% – 38.7% | 36.7% – 39.3% |
| Selling, general and administrative | $731.6M | $700.4M – $764.0M | $681.4M – $786.1M |
| Other operating expenses | $52.2M | $45.9M – $59.3M | $42.1M – $64.8M |
| Total operating expenses | $784.2M | $751.8M – $817.9M | $732.5M – $840.1M |
| Operating income | $134.5M | $100.2M – $170.4M | $79.1M – $196.3M |
| Net nonoperating income | $-1.2M | $-2.8M – $0.5M | $-4.1M – $1.7M |
| Pretax income | $133.3M | $98.8M – $169.3M | $78.0M – $195.3M |
| Income tax provision | $34.3M | $24.9M – $44.8M | $19.9M – $51.8M |
| Effective tax rate | 25.9% | 23.3% – 28.6% | 21.6% – 30.6% |
| Net income | $98.6M | $72.9M – $125.9M | $57.6M – $145.5M |
| Basic weighted-average shares | 92.53M | 91.57M – 93.51M | 90.86M – 94.25M |
| Diluted weighted-average shares | 93.16M | 92.16M – 94.23M | 91.48M – 94.97M |
| Diluted EPS | $1.06 | $0.78 – $1.35 | $0.62 – $1.57 |
Q1 FY27 · 2027-04-04
| GAAP measure | Median | 80% interval | 95% interval |
|---|---|---|---|
| Net sales | $2,471.9M | $2,346.1M – $2,608.1M | $2,260.8M – $2,704.1M |
| Cost of sales | $1,504.8M | $1,430.5M – $1,584.7M | $1,381.0M – $1,640.8M |
| Gross profit | $968.1M | $903.4M – $1,035.9M | $863.3M – $1,080.5M |
| Gross margin | 39.1% | 38.0% – 40.3% | 37.3% – 41.0% |
| Selling, general and administrative | $701.4M | $659.0M – $746.6M | $634.3M – $777.0M |
| Other operating expenses | $47.0M | $40.7M – $54.4M | $37.1M – $60.3M |
| Total operating expenses | $749.1M | $704.0M – $795.4M | $680.2M – $825.0M |
| Operating income | $218.2M | $170.0M – $270.2M | $140.7M – $300.8M |
| Net nonoperating income | $-1.4M | $-3.7M – $1.2M | $-5.3M – $2.9M |
| Pretax income | $216.9M | $169.1M – $269.1M | $138.5M – $299.5M |
| Income tax provision | $51.5M | $39.3M – $65.9M | $31.9M – $74.8M |
| Effective tax rate | 23.8% | 21.4% – 26.5% | 19.8% – 28.5% |
| Net income | $165.4M | $128.4M – $205.0M | $105.0M – $229.8M |
| Basic weighted-average shares | 91.60M | 89.94M – 93.35M | 88.80M – 94.56M |
| Diluted weighted-average shares | 92.29M | 90.58M – 94.12M | 89.44M – 95.35M |
| Diluted EPS | $1.79 | $1.39 – $2.22 | $1.14 – $2.50 |
Q2 FY27 · 2027-07-04
| GAAP measure | Median | 80% interval | 95% interval |
|---|---|---|---|
| Net sales | $2,439.7M | $2,273.4M – $2,616.3M | $2,172.1M – $2,740.1M |
| Cost of sales | $1,502.7M | $1,405.5M – $1,607.2M | $1,346.3M – $1,678.4M |
| Gross profit | $936.9M | $856.9M – $1,023.6M | $809.2M – $1,081.1M |
| Gross margin | 38.4% | 37.0% – 39.8% | 36.2% – 40.7% |
| Selling, general and administrative | $710.1M | $657.7M – $767.4M | $626.4M – $807.3M |
| Other operating expenses | $46.6M | $40.3M – $54.4M | $36.4M – $60.1M |
| Total operating expenses | $757.2M | $703.0M – $817.1M | $669.7M – $856.5M |
| Operating income | $178.4M | $123.6M – $236.9M | $89.0M – $273.3M |
| Net nonoperating income | $-1.4M | $-4.2M – $1.7M | $-5.8M – $3.7M |
| Pretax income | $177.1M | $122.4M – $236.2M | $87.1M – $272.3M |
| Income tax provision | $44.1M | $30.0M – $59.9M | $21.3M – $70.8M |
| Effective tax rate | 24.9% | 22.5% – 27.5% | 21.0% – 29.6% |
| Net income | $132.6M | $91.2M – $177.4M | $65.7M – $204.7M |
| Basic weighted-average shares | 90.80M | 88.50M – 93.23M | 86.97M – 94.66M |
| Diluted weighted-average shares | 91.34M | 89.00M – 93.80M | 87.45M – 95.38M |
| Diluted EPS | $1.45 | $1.00 – $1.95 | $0.72 – $2.24 |
Q3 FY27 · 2027-10-03
| GAAP measure | Median | 80% interval | 95% interval |
|---|---|---|---|
| Net sales | $2,435.4M | $2,237.1M – $2,644.1M | $2,116.1M – $2,805.1M |
| Cost of sales | $1,504.8M | $1,387.1M – $1,628.9M | $1,317.6M – $1,716.2M |
| Gross profit | $932.0M | $836.7M – $1,031.0M | $781.2M – $1,109.5M |
| Gross margin | 38.2% | 36.7% – 39.9% | 35.8% – 40.9% |
| Selling, general and administrative | $713.8M | $652.0M – $781.7M | $617.8M – $829.2M |
| Other operating expenses | $48.6M | $41.5M – $56.9M | $37.5M – $63.4M |
| Total operating expenses | $762.8M | $699.2M – $832.9M | $663.0M – $881.8M |
| Operating income | $167.5M | $105.3M – $235.2M | $72.4M – $274.3M |
| Net nonoperating income | $-1.2M | $-4.5M – $2.3M | $-6.5M – $4.6M |
| Pretax income | $166.2M | $103.9M – $233.6M | $70.9M – $272.9M |
| Income tax provision | $39.3M | $24.4M – $56.5M | $16.6M – $66.8M |
| Effective tax rate | 23.7% | 21.4% – 26.3% | 19.7% – 28.3% |
| Net income | $126.7M | $79.2M – $177.8M | $53.8M – $210.4M |
| Basic weighted-average shares | 90.07M | 87.24M – 93.07M | 85.44M – 95.01M |
| Diluted weighted-average shares | 90.70M | 87.83M – 93.73M | 86.05M – 95.73M |
| Diluted EPS | $1.40 | $0.87 – $1.97 | $0.59 – $2.32 |
Where the Q4 outlook diverges
Sprouts guided to $0.47–$0.51 of diluted EPS on a 13-week basis and estimated another $0.16 from week 14. Its full-year outlook implies approximately $2,415 million in Q4 sales and $82.7 million in operating income after including the extra week. Applying the model’s financing, tax and share-count draws to that operating income yields $0.65 of EPS at the median. Q3 release and fiscal-year outlook.
The historical model puts Q4 gross profit at $919.0M and gross margin at 38.0%. With sales, operating expenses, financing, tax rate and shares held fixed on each draw, one percentage point of gross margin moves EPS by about $0.19. Reaching the $0.65 outlook midpoint through gross margin alone would require about 35.8% gross margin. Higher operating expenses, or a combination of costs and margin pressure, could also close the gap.
From sales to earnings
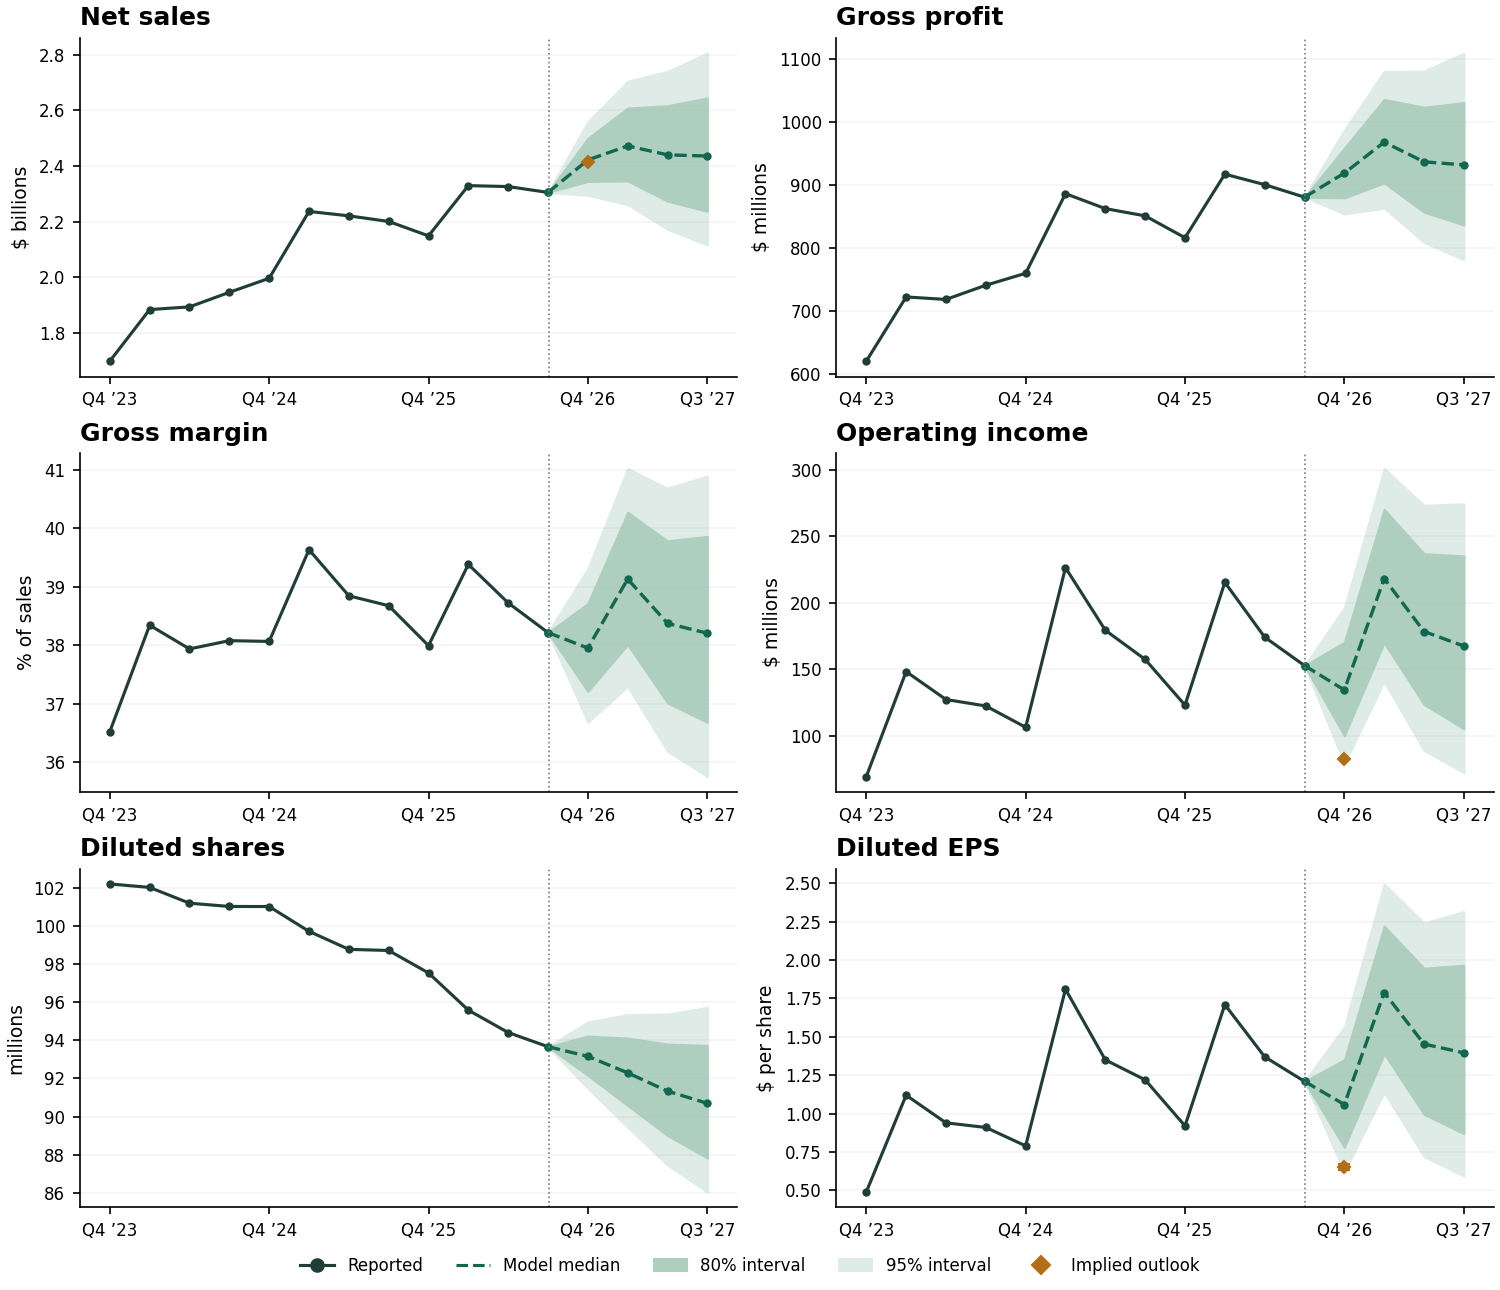
Revenue and gross profit. A seasonal autoregression models quarterly changes in log sales per fiscal week. For each revenue draw, a second regression estimates gross margin using the previous quarter’s margin, fiscal season and simulated weekly sales growth. Multiplying sales by this margin gives gross profit. Cost of sales is the difference between revenue and gross profit.
Operating expenses. SG&A as a share of sales responds to weekly sales growth and the simulated change in gross margin. A separate regression estimates the share of sales used for other operating expenses, including depreciation outside cost of sales and store-closure charges. Subtracting both expenses from gross profit gives operating income.
Taxes, shares and EPS. Each path adds simulated net nonoperating income to operating income, applies an effective tax rate to pretax profit, and divides net income by weighted-average diluted shares. The share model estimates basic share growth and the dilution premium separately. Loss paths use basic shares. The effective-rate assumption allows tax benefits on losses.
Historical forecast accuracy
Across 12 one-quarter-ahead forecasts, diluted EPS missed by $0.10 on average and gross profit by $18.1M. The table compares absolute errors with carrying forward the last quarter or repeating the same quarter a year earlier.
| Target | Quarters ahead | Forecasts | Model MAE | Last quarter | Year earlier | Inside 80% |
|---|---|---|---|---|---|---|
| Net sales | 1 | 12 | $33.4M | $70.4M | $199.4M | 11/12 |
| Gross profit | 1 | 12 | $18.1M | $40.5M | $86.7M | 11/12 |
| Operating income | 1 | 12 | $10.2M | $43.1M | $30.4M | 12/12 |
| Net income | 1 | 12 | $9.4M | $35.7M | $24.8M | 11/12 |
| Diluted weighted-average shares | 1 | 12 | 0.52M | 0.75M | 3.06M | 12/12 |
| Diluted EPS | 1 | 12 | $0.10 | $0.36 | $0.25 | 11/12 |
| Diluted EPS | 2 | 11 | $0.13 | $0.47 | $0.27 | 10/11 |
| Diluted EPS | 3 | 10 | $0.16 | $0.45 | $0.25 | 10/10 |
| Diluted EPS | 4 | 9 | $0.20 | $0.25 | $0.25 | 8/9 |
Each historical forecast refits both models using only quarters through that origin. The tests use the latest available filing revisions. Longer horizons share some outcomes, and all scored targets had 13 weeks. The tests provide limited evidence about a 14-week quarter or the size of the current management-model gap.
Estimation, convergence and source data
The sample covers 35 consecutive quarters from Q1 FY2018 through Q3 FY2026. PyMC’s NUTS sampler fits the seasonal AR(1) revenue model. Blocked Gibbs sampling fits seven accounting regressions with Student-t errors (five degrees of freedom), proper normal/inverse-gamma priors and fiscal-quarter effects. The model carries each draw’s coefficients and evolving states through all four quarters. Conditional shocks are independent across accounting equations after their stated predictors. Gross margins, SG&A rates and effective tax rates use a logit transform.
Each final fit used four chains of 1,500 retained draws. Maximum rank-normalized R̂ was 1.002, minimum bulk effective sample size was 2,422, and revenue NUTS recorded zero divergences. Forecast bands cover uncertainty in parameters and future shocks under the fitted relationships. The model extrapolates historical sales and cost behavior, including past repurchases. It has no separate inputs for store openings, comp sales, promotions or the current disruption.
Quarterly dollar amounts come from SEC company facts, with annual less nine-month values used when Q4 dollar flows require reconstruction. Quarterly EPS and weighted-average shares come directly from filings or issuer Q4 comparative statements. The EPS calculation reconciles to reported rounding in all 35 quarters. SEC company facts · 2019 Q4 release · 2021 Q4 release · 2023 Q4 release · 2025 Q4 release.