Sofi Technologies, Inc. SOFI
Revenue Intelligence Report • 22 quarters of SEC filing data • Updated 2026-03-15
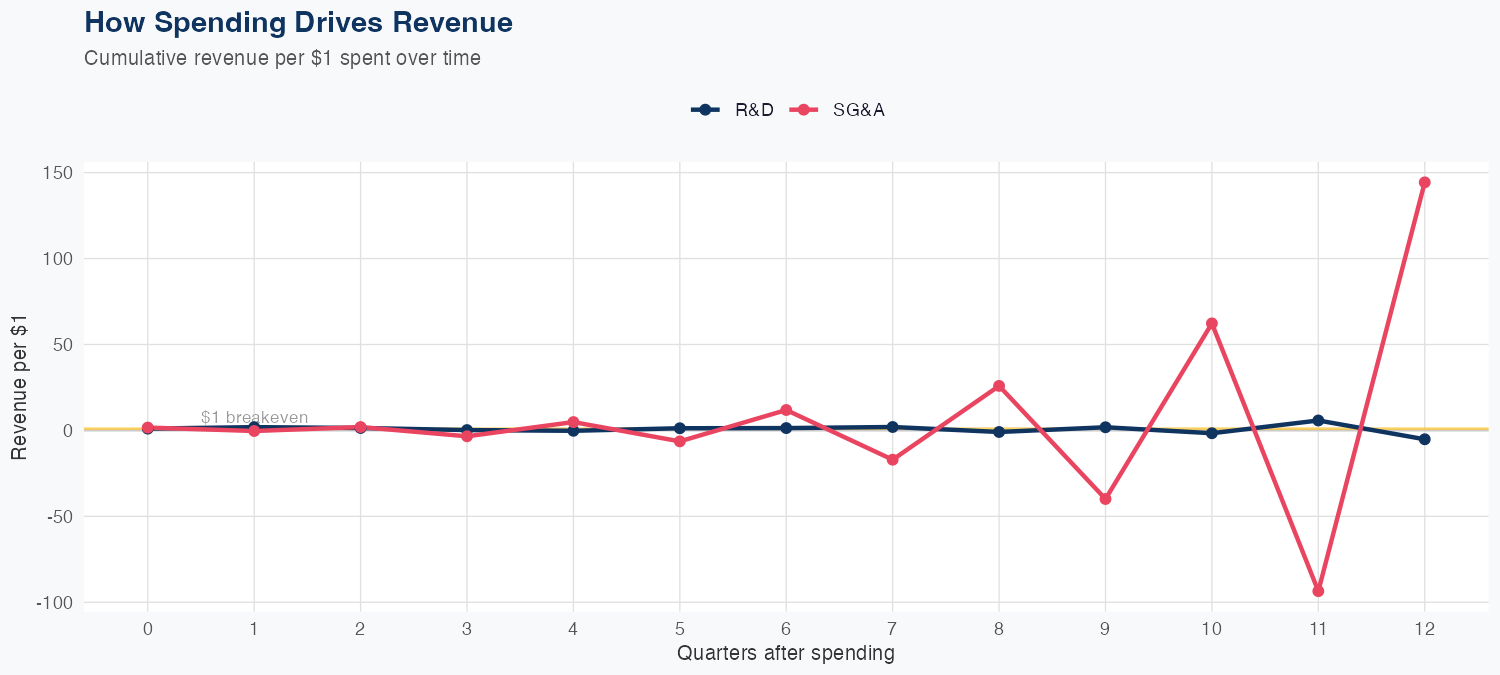
Revenue appears to be driven primarily by SG&A spending, with $1 of SG&A generating $144.32 of long-run revenue, while $1 of R&D spending yields a negative $5.15 in long-run revenue. The model is linear with a 1.0% MAPE, but holdout testing produced a sizeable miss (predicted $137M vs actual $170M, about 19.3% error), signaling forecast risk. The FY revenue outlook is about $611M, representing a -1.4% year-over-year change and implying modest top-line headwinds. Investors should consider the strong SG&A ROI alongside the negative R&D ROI and the holdout miss as potential risks to the sustainability of the forecast.
Investment Thesis
Our ARDL model tracks Sofi Technologies, Inc.'s revenue with exceptional precision (1.0% MAPE), indicating highly predictable cash flows. Each $1 of SG&A spending generates $144.32 in revenue, reflecting strong commercial efficiency.
Revenue Forecast
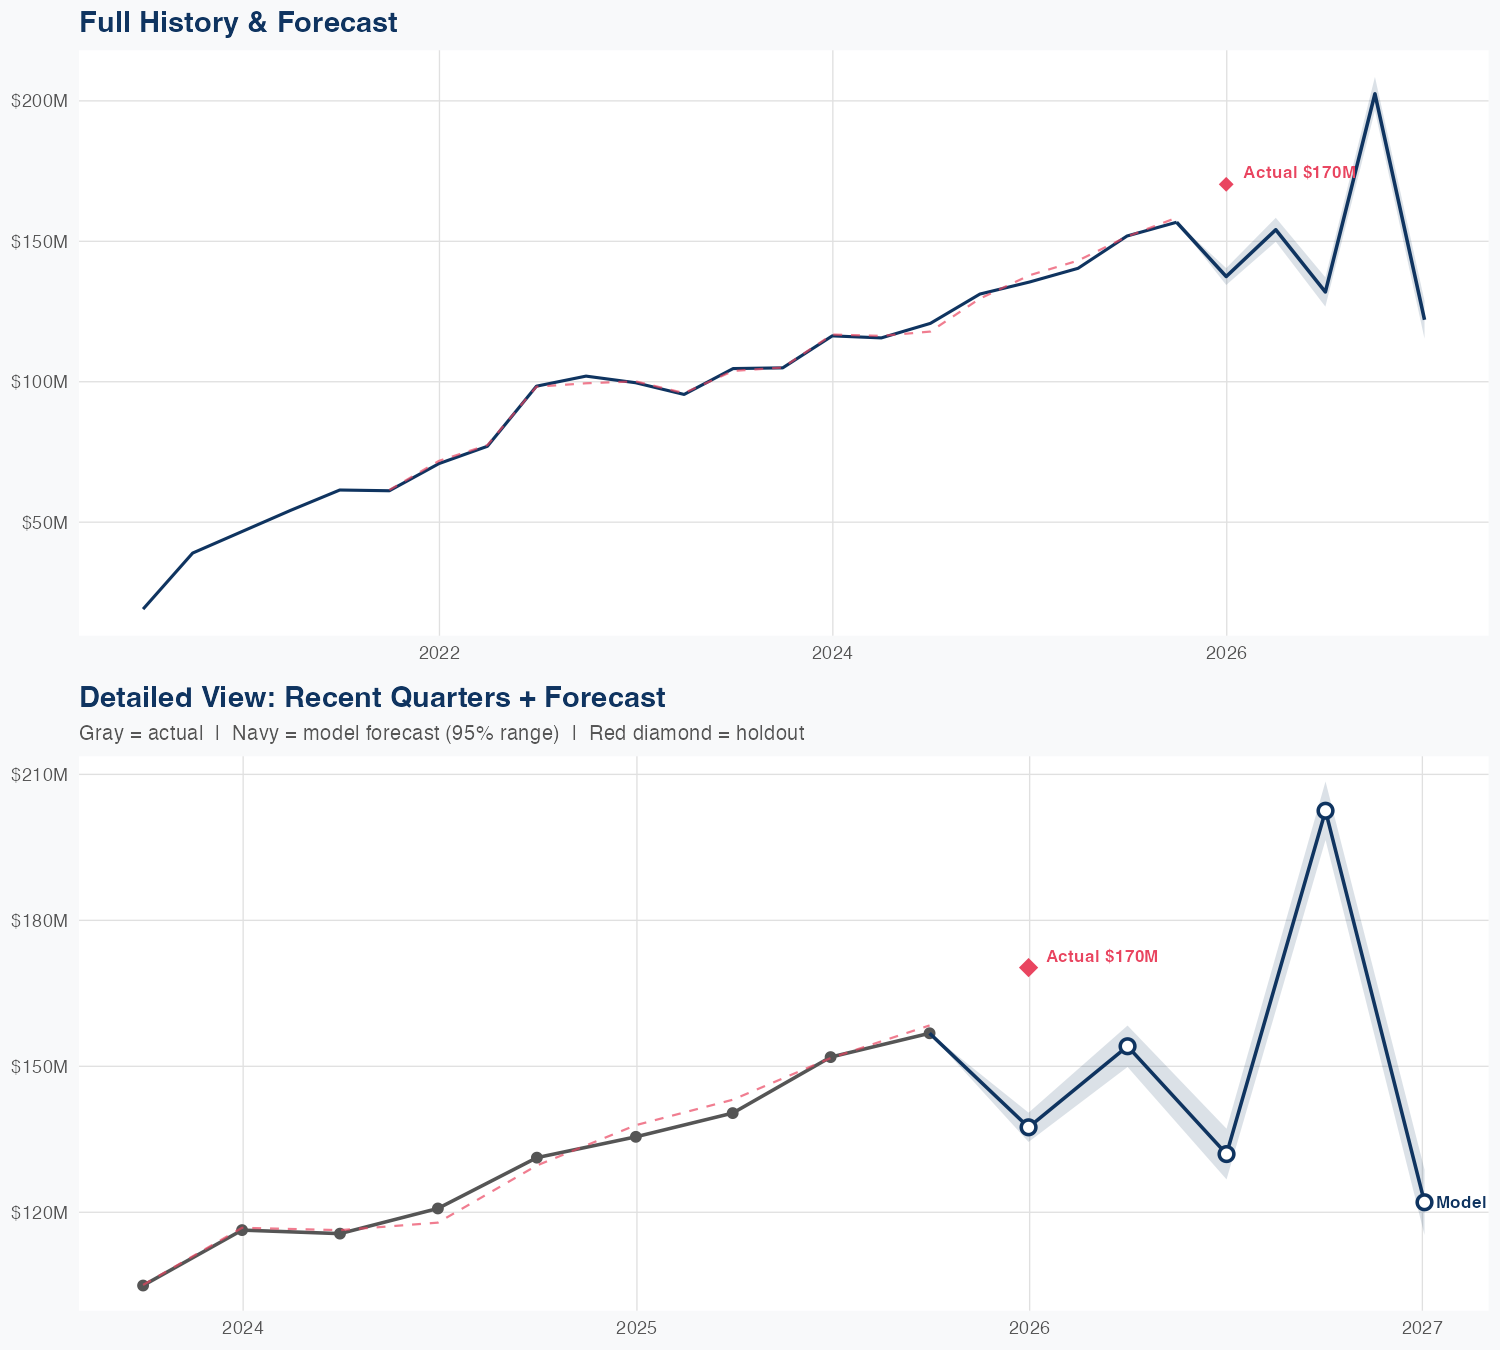
Quarterly Detail
| Quarter | Model Forecast | Actual | 95% Range | YoY Growth | Status |
|---|---|---|---|---|---|
| Q4 2025 | $137M | $170M | $134M – $140M | +1.4% | ✗ Outside range |
| Q2 2026 | $154M | $150M – $158M | +9.8% | ||
| Q3 2026 | $132M | $127M – $137M | -13.1% | ||
| Q4 2026 | $203M | $197M – $209M | +29.2% | ||
| Q1 2027 | $122M | $115M – $129M | -28.3% |
Seasonal Factors
| Fiscal Quarter | Seasonal Factor | vs Trend | Interpretation | Obs. |
|---|---|---|---|---|
| FQ1 (Sep–Nov) | 0.9989 | -0.1% | In line with trend | 5 |
| FQ2 (Dec–Feb) | 0.9951 | -0.5% | In line with trend | 5 |
| FQ3 (Mar–May) | 0.9945 | -0.5% | In line with trend | 4 |
| FQ4 (Jun–Aug) | 1.0082 | +0.8% | In line with trend | 4 |
How Spending Drives Revenue
Want this analysis for your portfolio?
I build custom revenue intelligence reports for investors and companies using SEC filing data, econometric modeling, and AI-powered insights.
Get in Touch