Ss&c Technologies Holdings, Inc. SSNC
Revenue Intelligence Report • 62 quarters of SEC filing data • Updated 2026-03-15
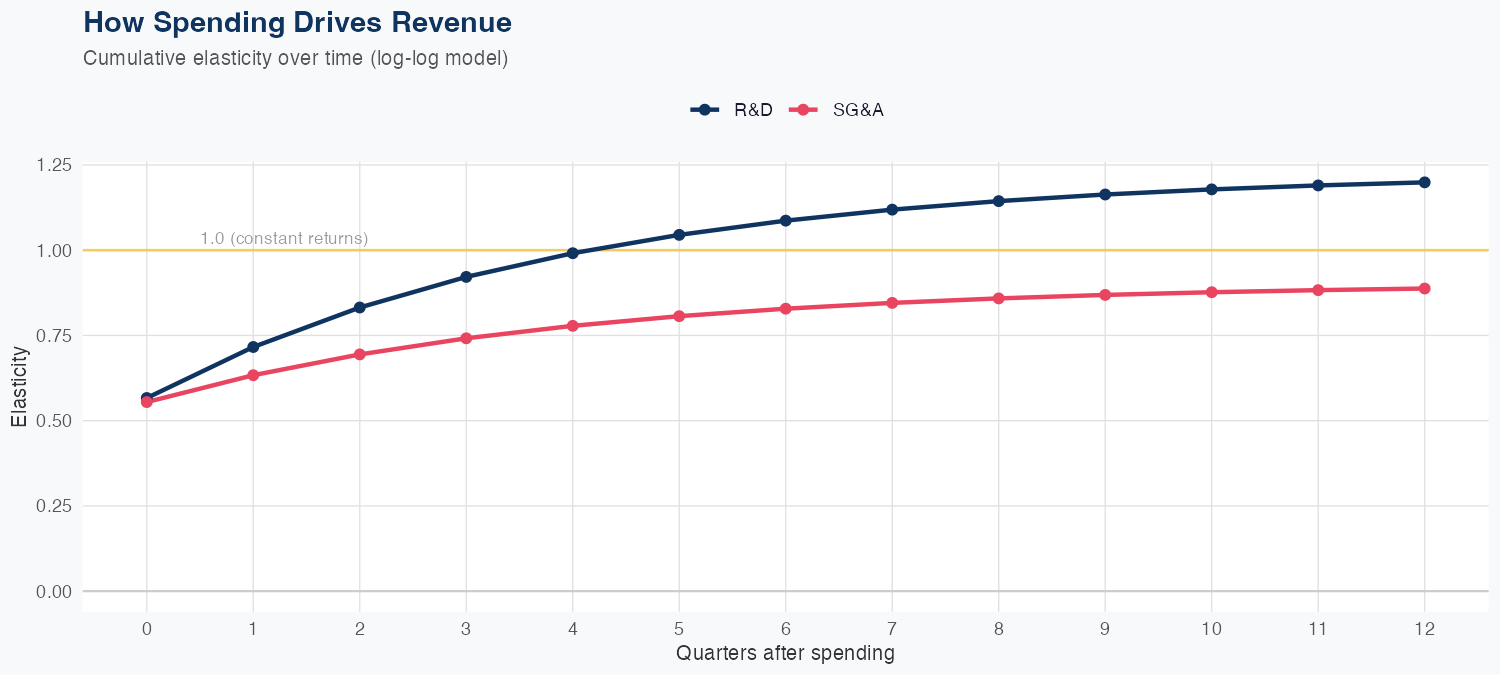
Revenue is driven primarily by R&D spending, with a 1% increase in R&D yielding a 1.20% rise in revenue, while SG&A adds 0.89% per 1% spend, indicating higher ROI on R&D under the current model. The log-log framework shows solid forecasting performance, with a 3.5% MAPE and a holdout error of 2.9% (predicted 1.6B vs actual 1.7B), supporting reliable revenue guidance. The full-year forecast is about 6.4B in revenue, up 2.1% year over year, signaling modest but steady growth. Looking ahead, sustained R&D investment appears to be the key growth lever, while SG&A efficiency should be carefully managed to sustain margin and returns.
Investment Thesis
The econometric model achieves strong accuracy (3.5% MAPE), suggesting Ss&c Technologies Holdings, Inc.'s revenue trajectory is well-characterized by its spending patterns. R&D investment shows a 1.20x multiplier — each 1% increase in R&D spend is associated with a 1.20% revenue increase, signaling strong innovation-to-revenue conversion. Sales & marketing spend shows a 0.89x elasticity, suggesting effective go-to-market execution.
Revenue Forecast
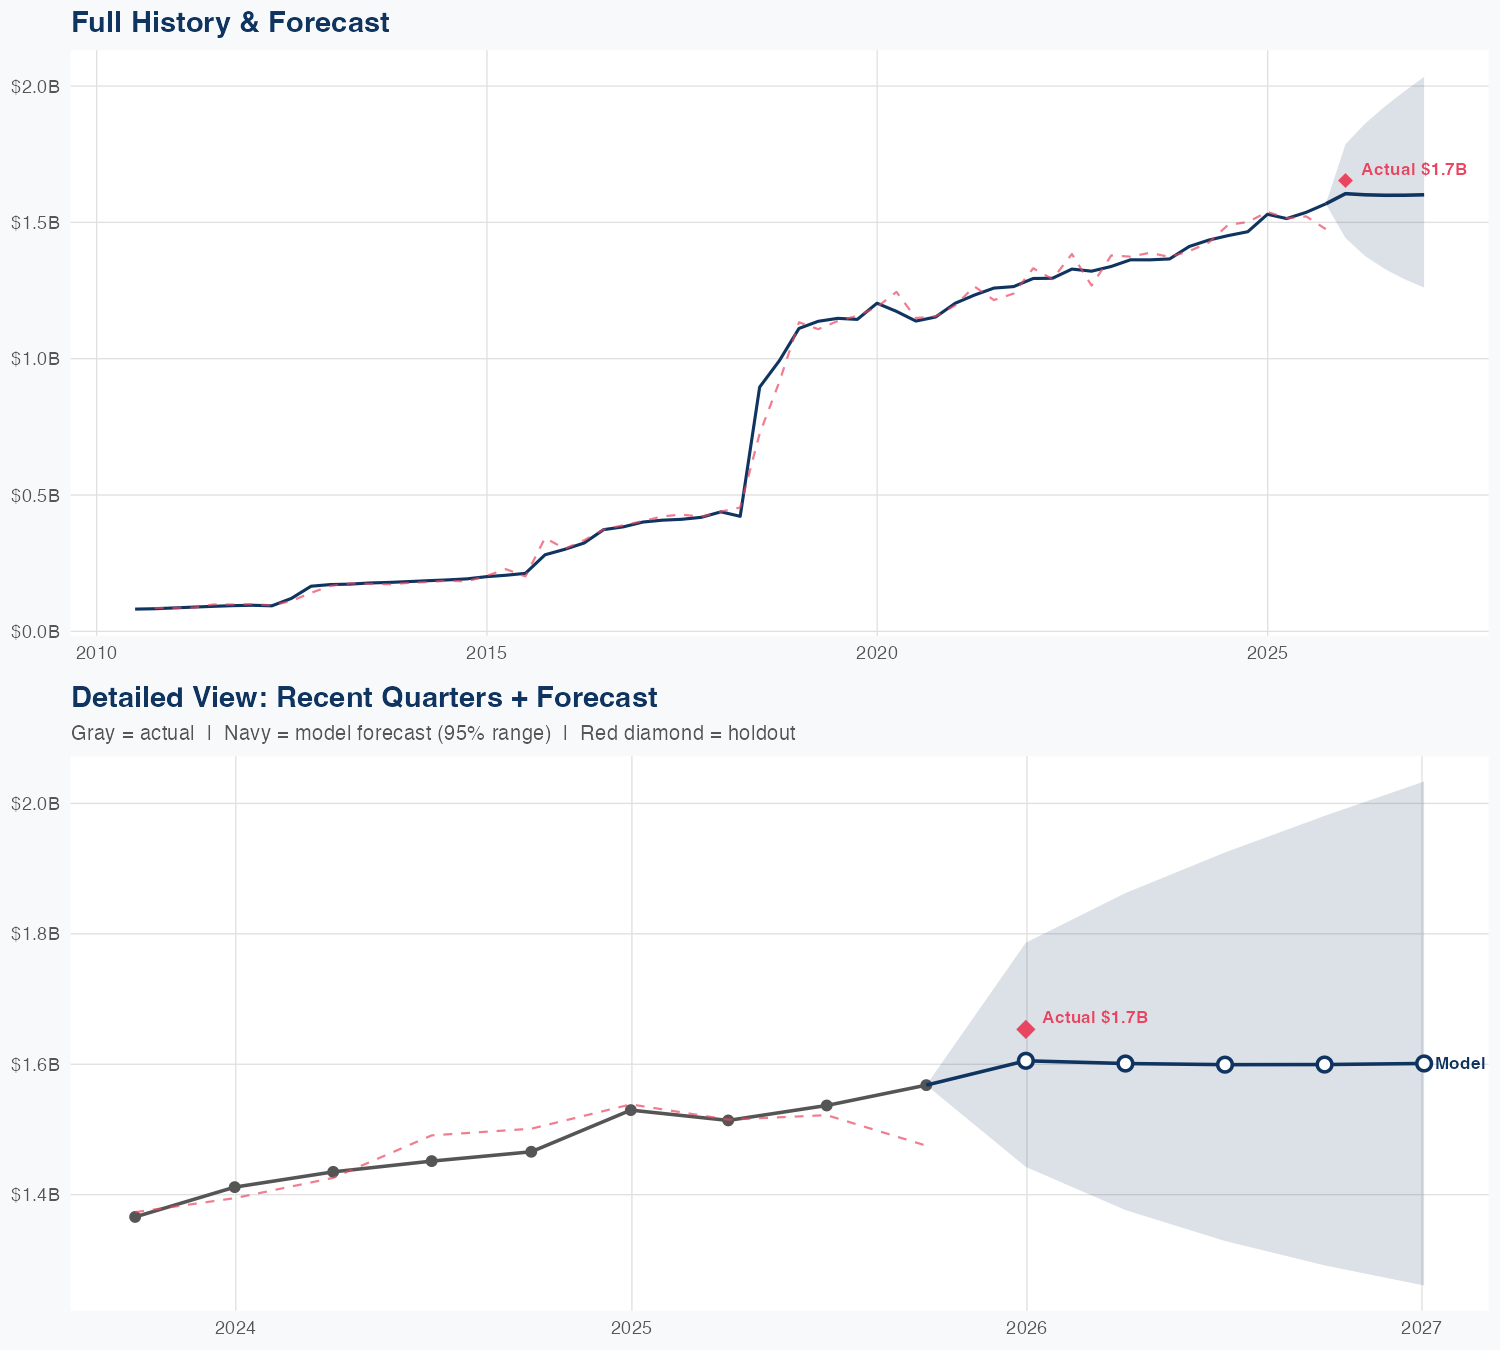
Quarterly Detail
| Quarter | Model Forecast | Actual | 95% Range | YoY Growth | Status |
|---|---|---|---|---|---|
| Q4 2025 | $1.6B | $1.7B | $1.4B – $1.8B | +4.9% | ✓ In range |
| Q2 2026 | $1.6B | $1.4B – $1.9B | +5.8% | ||
| Q3 2026 | $1.6B | $1.3B – $1.9B | +4.1% | ||
| Q4 2026 | $1.6B | $1.3B – $2.0B | +2.0% | ||
| Q1 2027 | $1.6B | $1.3B – $2.0B | -3.2% |
Seasonal Factors
| Fiscal Quarter | Seasonal Factor | vs Trend | Interpretation | Obs. |
|---|---|---|---|---|
| FQ1 (Sep–Nov) | 0.9979 | -0.2% | In line with trend | 16 |
| FQ2 (Dec–Feb) | 0.9943 | -0.6% | In line with trend | 15 |
| FQ3 (Mar–May) | 0.985 | -1.5% | In line with trend | 15 |
| FQ4 (Jun–Aug) | 1.0088 | +0.9% | In line with trend | 15 |
How Spending Drives Revenue
Want this analysis for your portfolio?
I build custom revenue intelligence reports for investors and companies using SEC filing data, econometric modeling, and AI-powered insights.
Get in Touch