Atlassian Corporation TEAM
Revenue Intelligence Report • 14 quarters of SEC filing data • Updated 2026-03-15
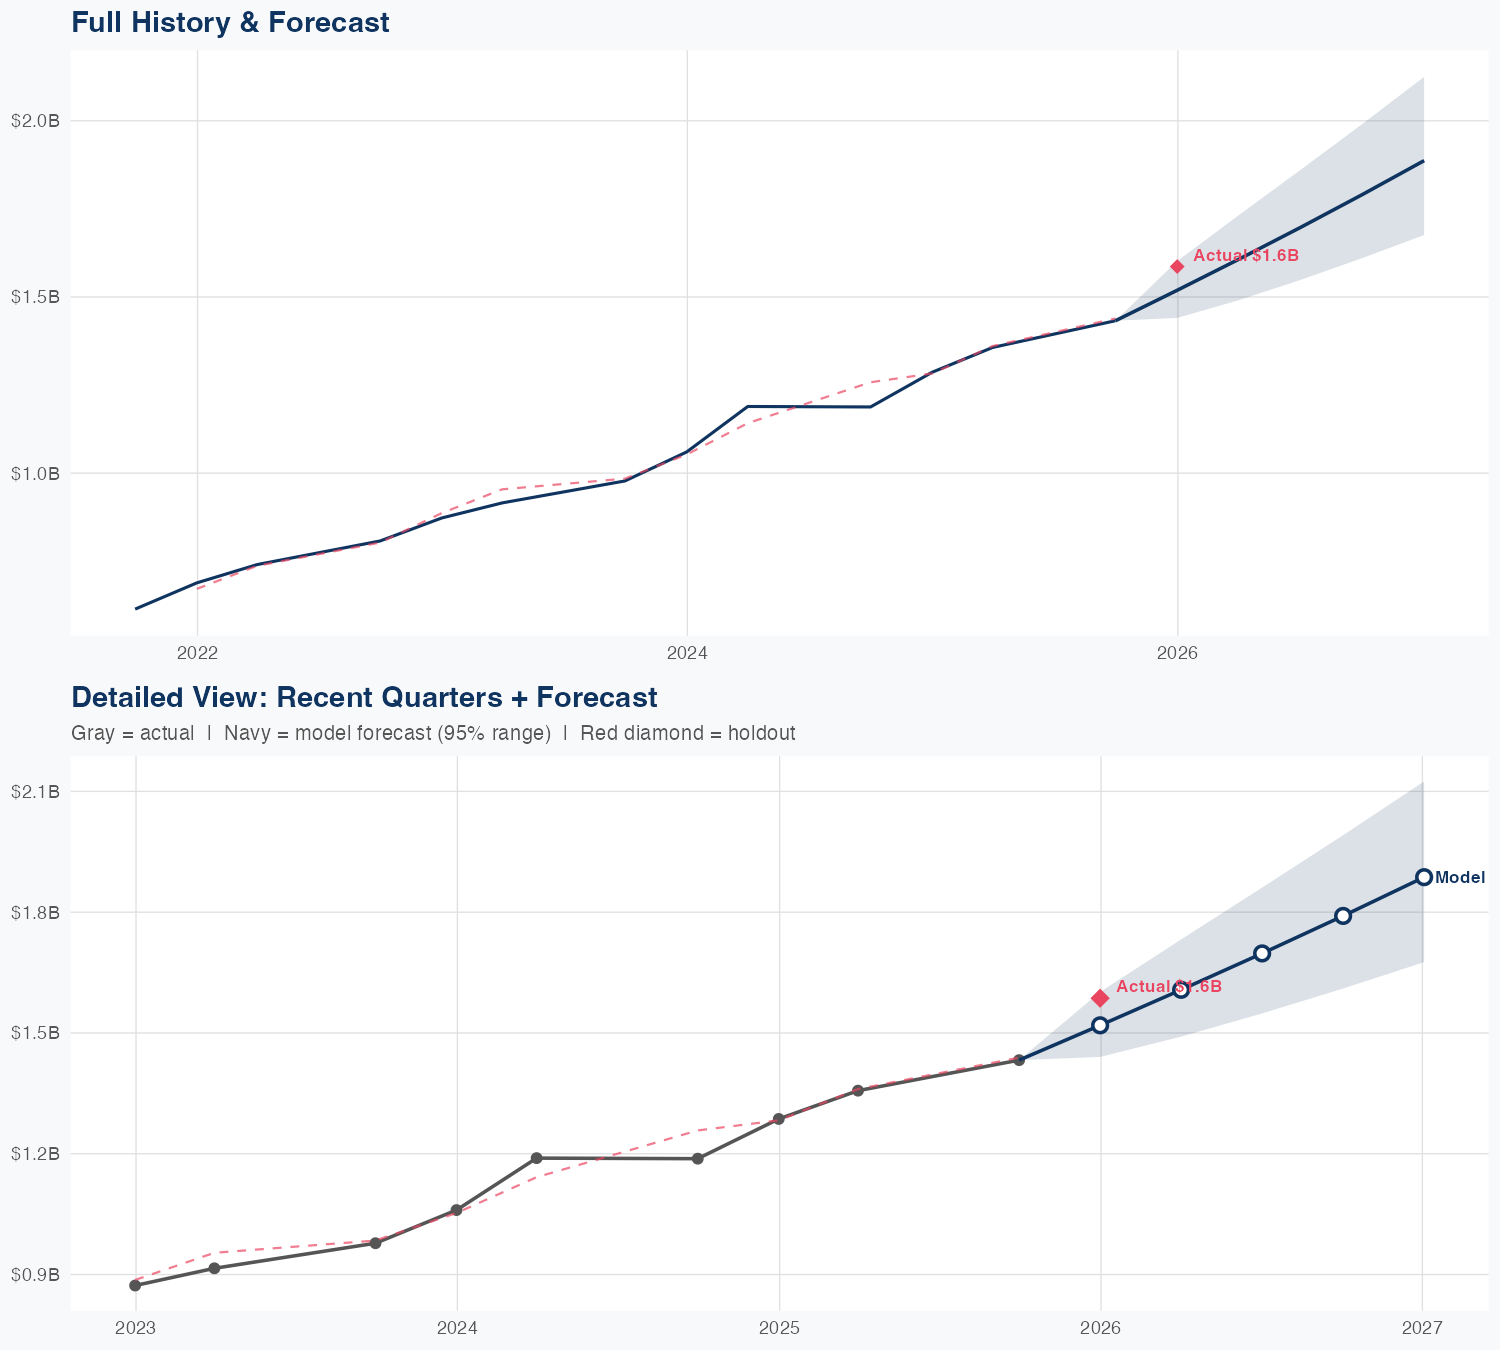
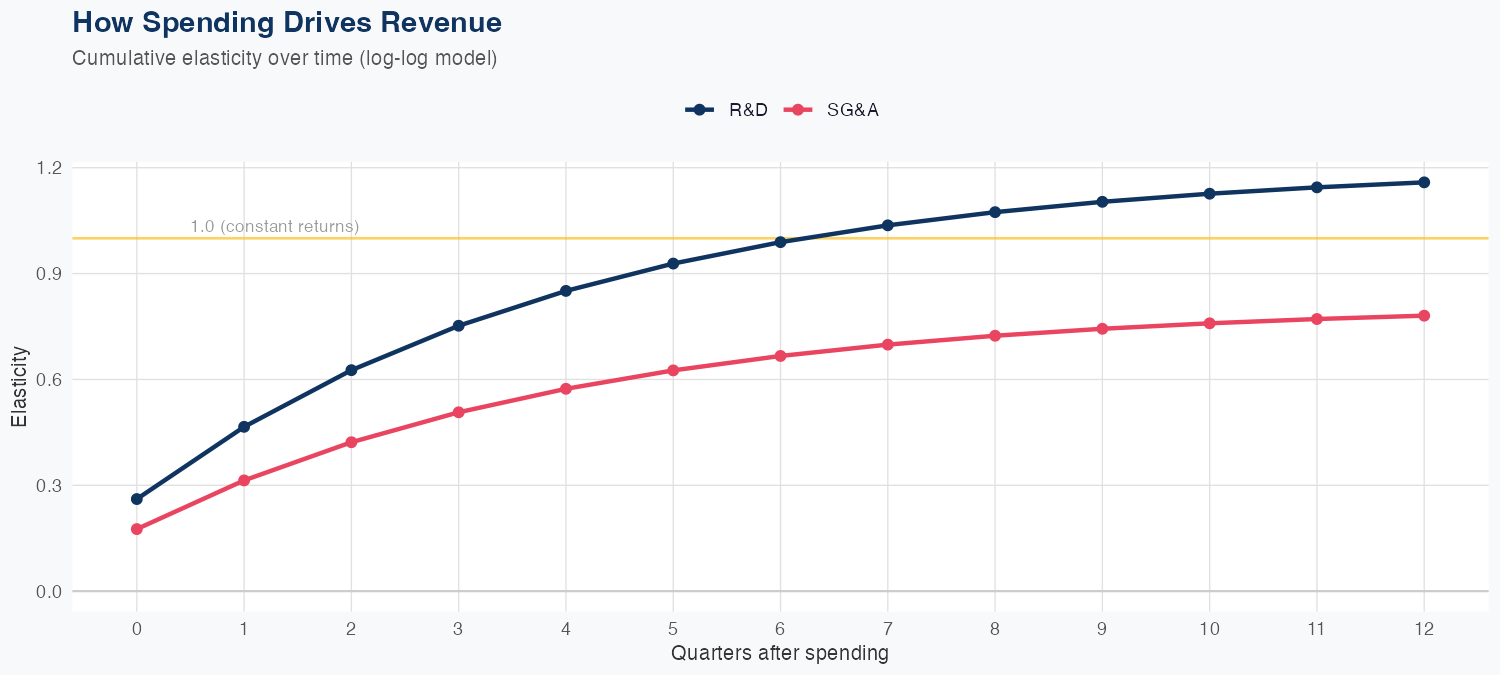
R&D is the primary driver of revenue, with a 1% increase in R&D spend associated with a 1.16% lift in revenue, while a 1% increase in SG&A yields a 0.78% revenue uplift, reflecting a higher ROI from R&D under a log-log framework. The model shows 2.0% MAPE accuracy, and a holdout test predicted 1.5B versus 1.6B actual, a 4.2% error, indicating solid short-term predictive power. The FY revenue forecast is 7.0B, up 23.3% year over year, signaling a robust growth trajectory. Given the stronger elasticity of R&D relative to SG&A, continued investment in product development appears to be the key driver of sustainable revenue growth.
Investment Thesis
Our ARDL model tracks Atlassian Corporation's revenue with exceptional precision (2.0% MAPE), indicating highly predictable cash flows. R&D investment shows a 1.16x multiplier — each 1% increase in R&D spend is associated with a 1.16% revenue increase, signaling strong innovation-to-revenue conversion. Sales & marketing spend shows a 0.78x elasticity, suggesting effective go-to-market execution.
Revenue Forecast
Quarterly Detail
| Quarter | Model Forecast | Actual | 95% Range | YoY Growth | Status |
|---|---|---|---|---|---|
| Q4 2025 | $1.5B | $1.6B | $1.4B – $1.6B | +27.9% | ✓ In range |
| Q2 2026 | $1.6B | $1.5B – $1.7B | +24.9% | ||
| Q3 2026 | $1.7B | $1.5B – $1.9B | +25.1% | ||
| Q4 2026 | $1.8B | $1.6B – $2.0B | +25.0% | ||
| Q1 2027 | $1.9B | $1.7B – $2.1B | +19.0% |
Seasonal Factors
| Fiscal Quarter | Seasonal Factor | vs Trend | Interpretation | Obs. |
|---|---|---|---|---|
| FQ1 (Sep–Nov) | 0.9956 | -0.4% | In line with trend | 4 |
| FQ2 (Dec–Feb) | 1.0068 | +0.7% | In line with trend | 5 |
| FQ3 (Mar–May) | 1.0047 | +0.5% | In line with trend | 4 |
| FQ4 (Jun–Aug) | 1.0 | +0.0% | In line with trend | 0 |
How Spending Drives Revenue
Want this analysis for your portfolio?
I build custom revenue intelligence reports for investors and companies using SEC filing data, econometric modeling, and AI-powered insights.
Get in Touch