Tpg Inc. TPG
Revenue Intelligence Report • 20 quarters of SEC filing data • Updated 2026-03-15
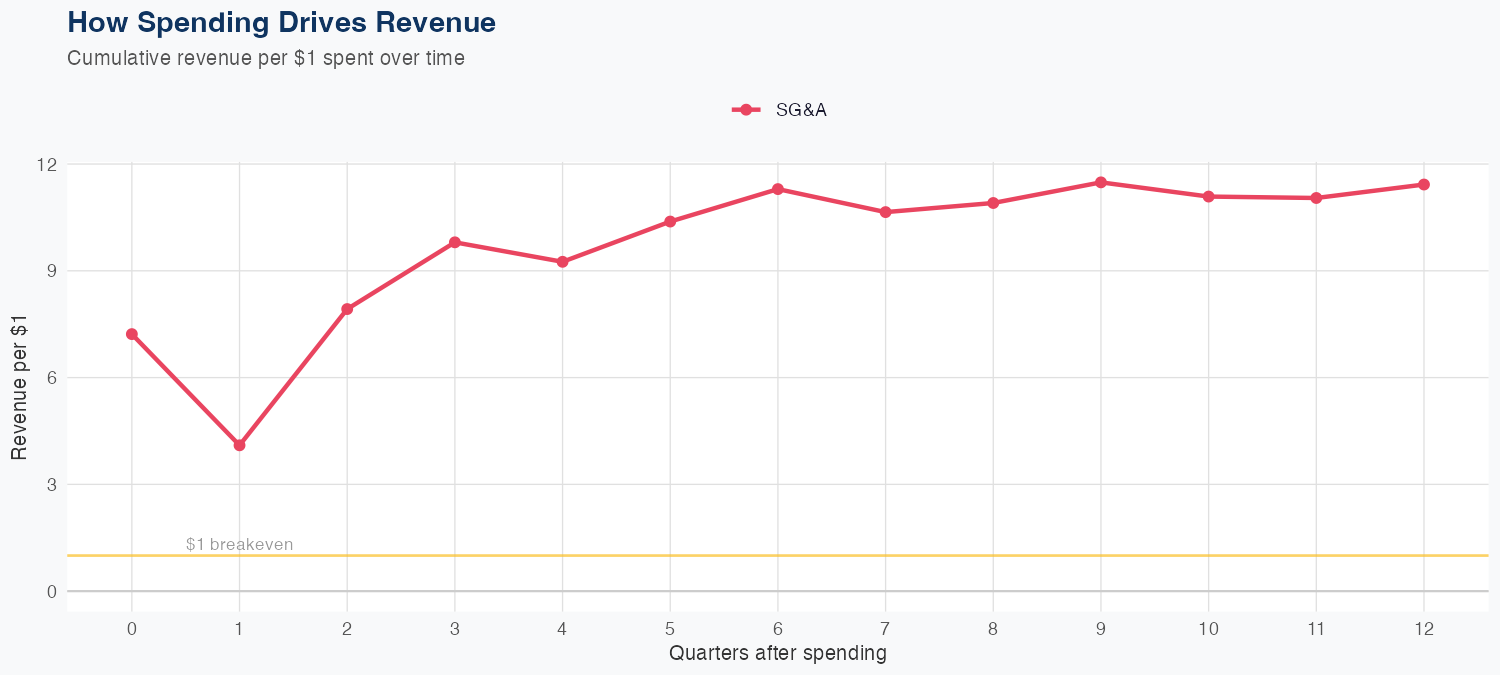
Revenue appears driven by SG&A spend, with the model implying $1 of SG&A generates $11.42 of long-run revenue; no R&D input is available to support additional growth. However, the modeling shows modest predictive performance (MAPE 32.7%), and a holdout miss of 20.5% (predicted $1.2B vs actual $1.5B), signaling meaningful forecast risk. The most recent quarterly revenue was $1.491B and the FY forecast is $4.6B, down 1.9% year over year, implying near-term softness despite SG&A-driven revenue potential. Given the reliance on SG&A without corroborating R&D input, investors should gauge SG&A efficiency and monitor cost structure shifts, as the long-run ROI looks attractive but near-term outcomes carry uncertainty.
Investment Thesis
At 32.7% MAPE, the model captures Tpg Inc.'s broad revenue trajectory, though quarterly variability suggests sensitivity to external factors. Each $1 of SG&A spending generates $11.42 in revenue, reflecting strong commercial efficiency.
Revenue Forecast
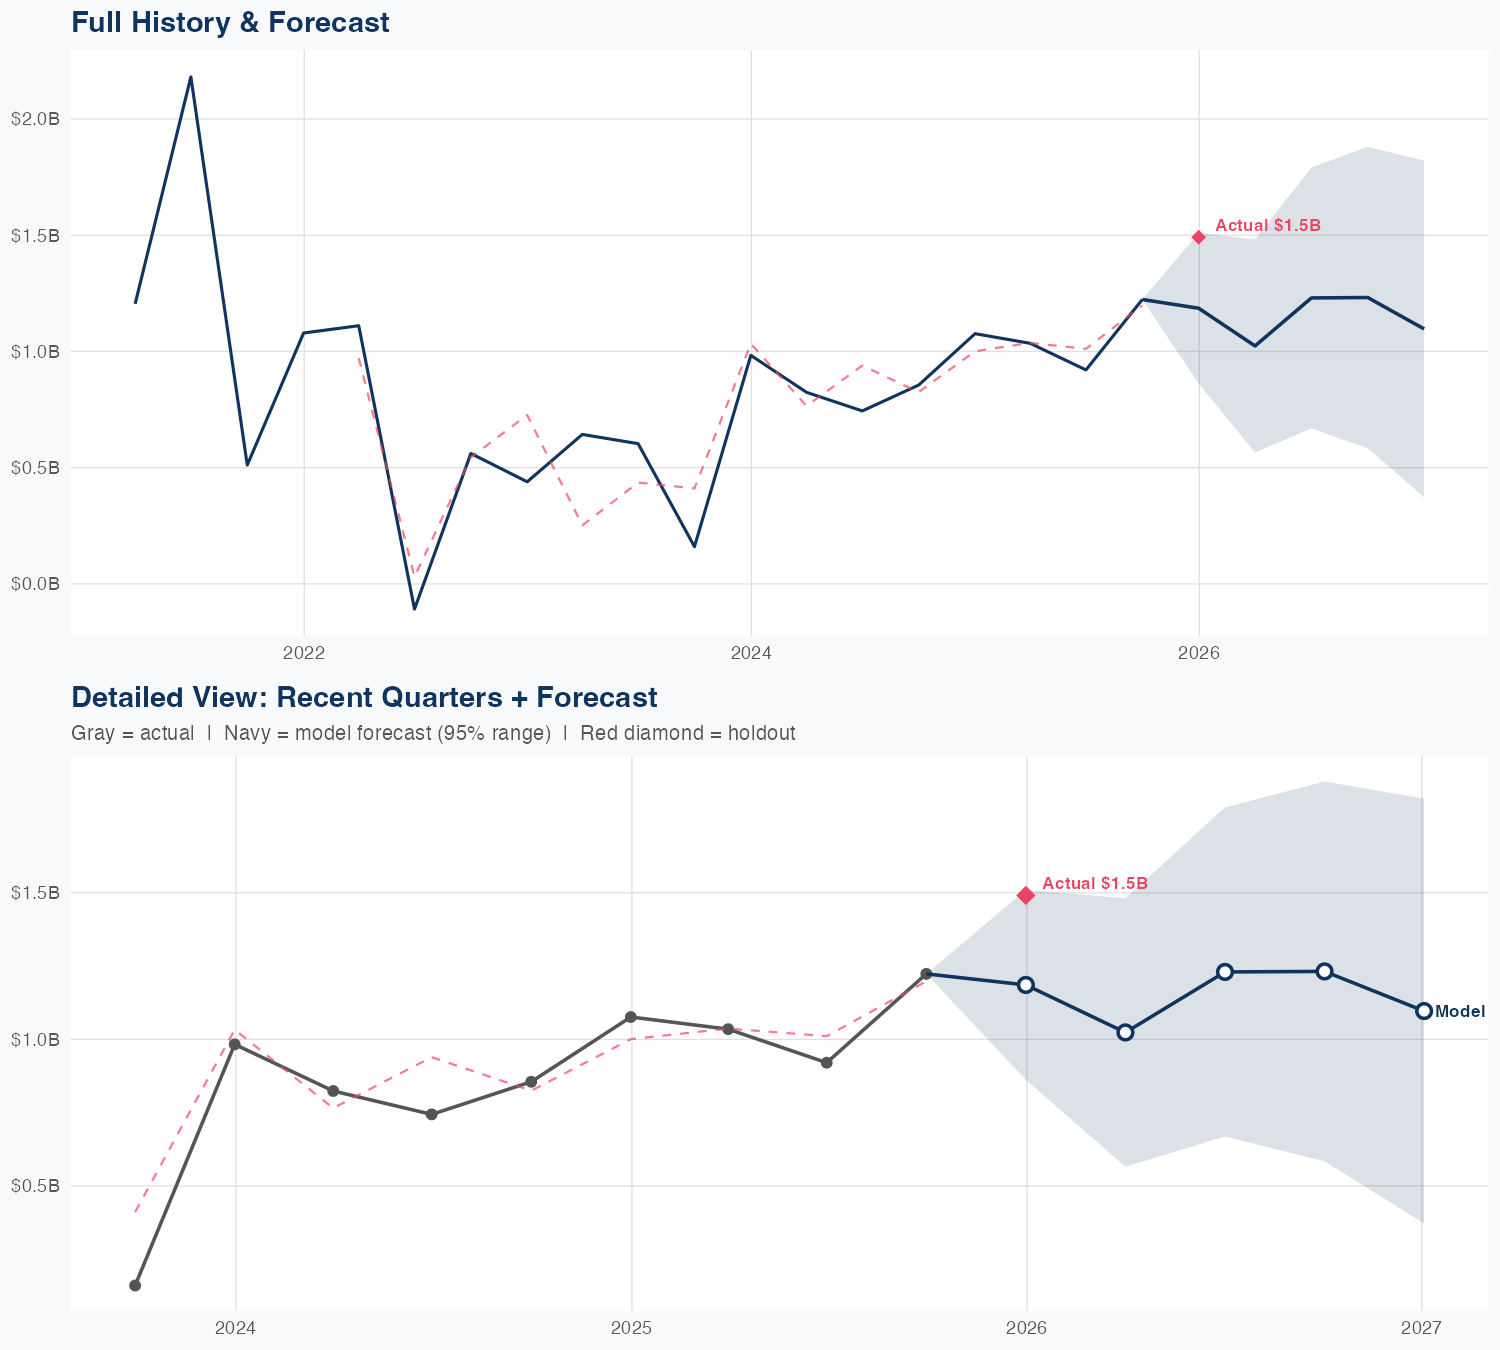
Quarterly Detail
| Quarter | Model Forecast | Actual | 95% Range | YoY Growth | Status |
|---|---|---|---|---|---|
| Q4 2025 | $1.2B | $1.5B | $0.9B – $1.5B | +10.2% | ✓ In range |
| Q2 2026 | $1.0B | $0.6B – $1.5B | -1.1% | ||
| Q3 2026 | $1.2B | $0.7B – $1.8B | +33.6% | ||
| Q4 2026 | $1.2B | $0.6B – $1.9B | +0.7% | ||
| Q1 2027 | $1.1B | $0.4B – $1.8B | -26.5% |
Seasonal Factors
| Fiscal Quarter | Seasonal Factor | vs Trend | Interpretation | Obs. |
|---|---|---|---|---|
| FQ1 (Sep–Nov) | 1.0306 | +3.1% | +3.1% above trend | 4 |
| FQ2 (Dec–Feb) | 1.0755 | +7.6% | +7.6% above trend | 4 |
| FQ3 (Mar–May) | 1.1434 | +14.3% | +14.3% above trend | 4 |
| FQ4 (Jun–Aug) | 0.9104 | -9.0% | -9.0% below trend | 4 |
How Spending Drives Revenue
Want this analysis for your portfolio?
I build custom revenue intelligence reports for investors and companies using SEC filing data, econometric modeling, and AI-powered insights.
Get in Touch