Texas Pacific Land Corporation TPL
Revenue Intelligence Report • 24 quarters of SEC filing data • Updated 2026-03-15
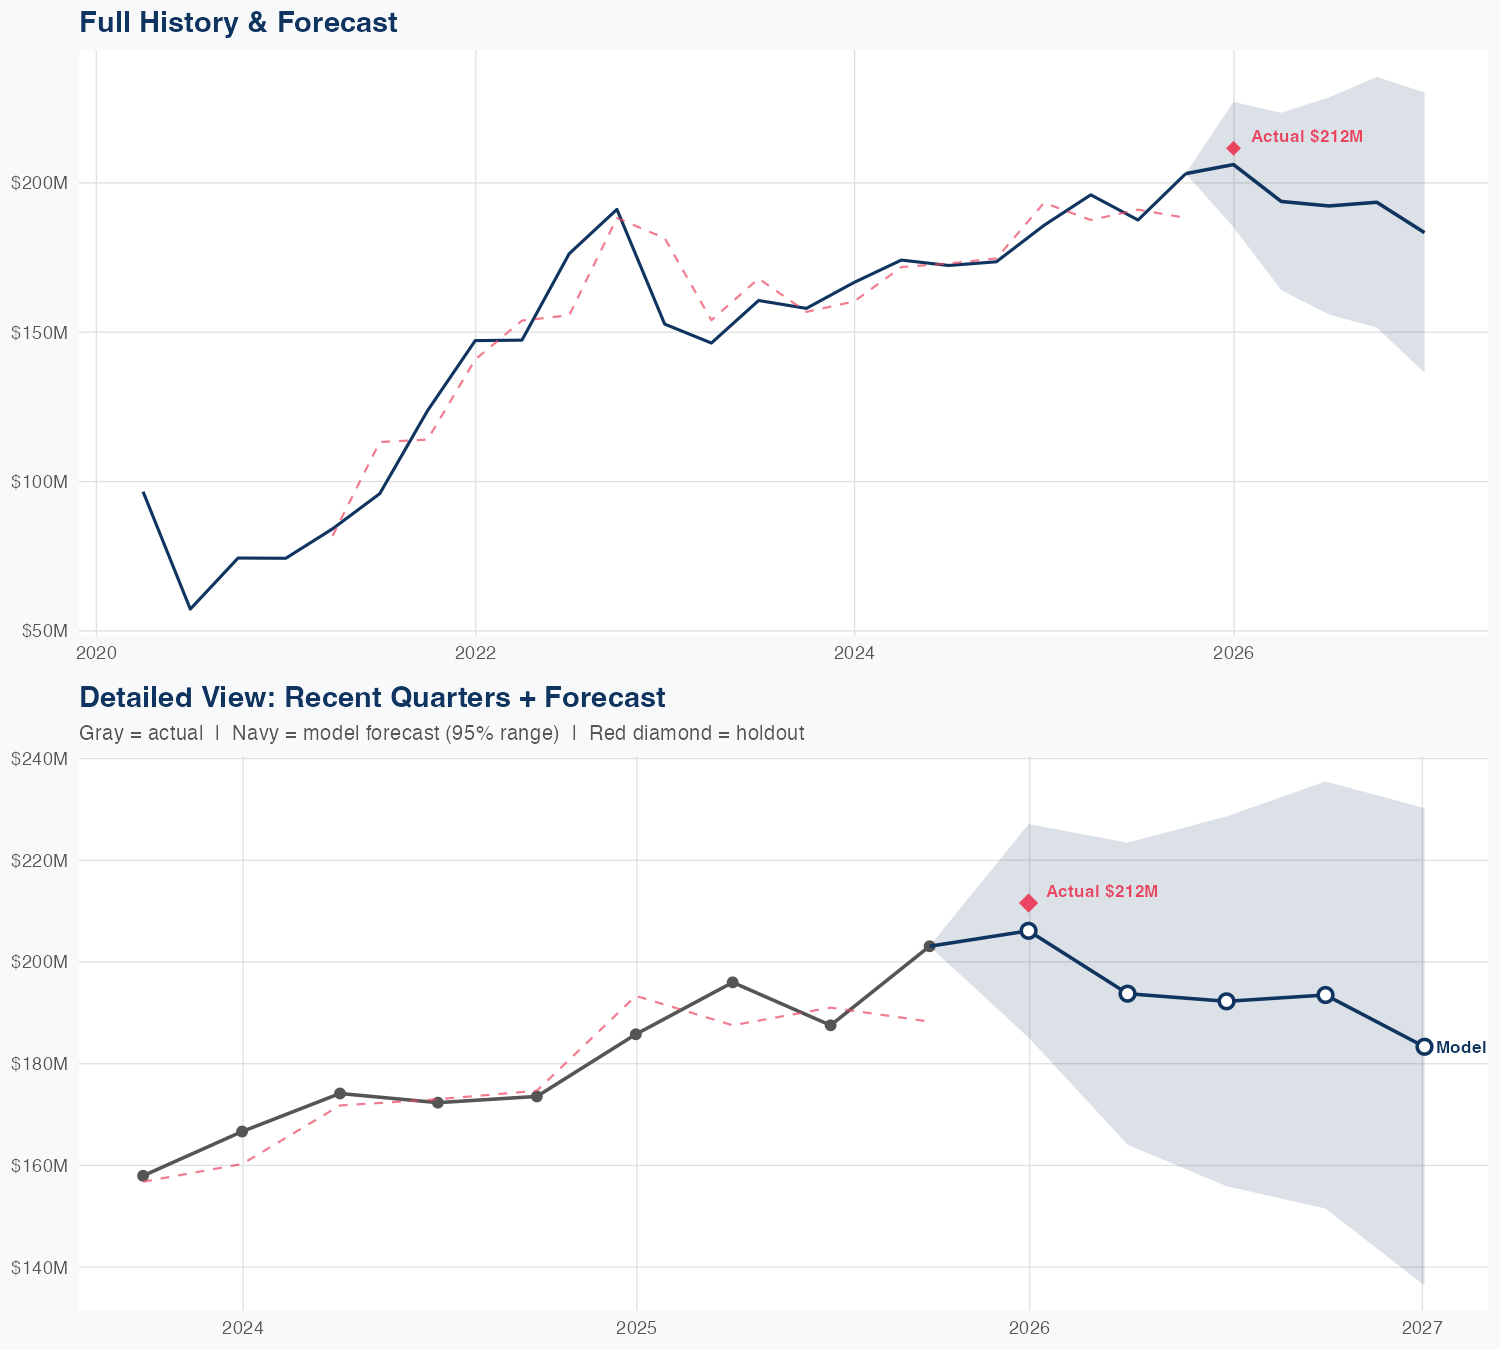
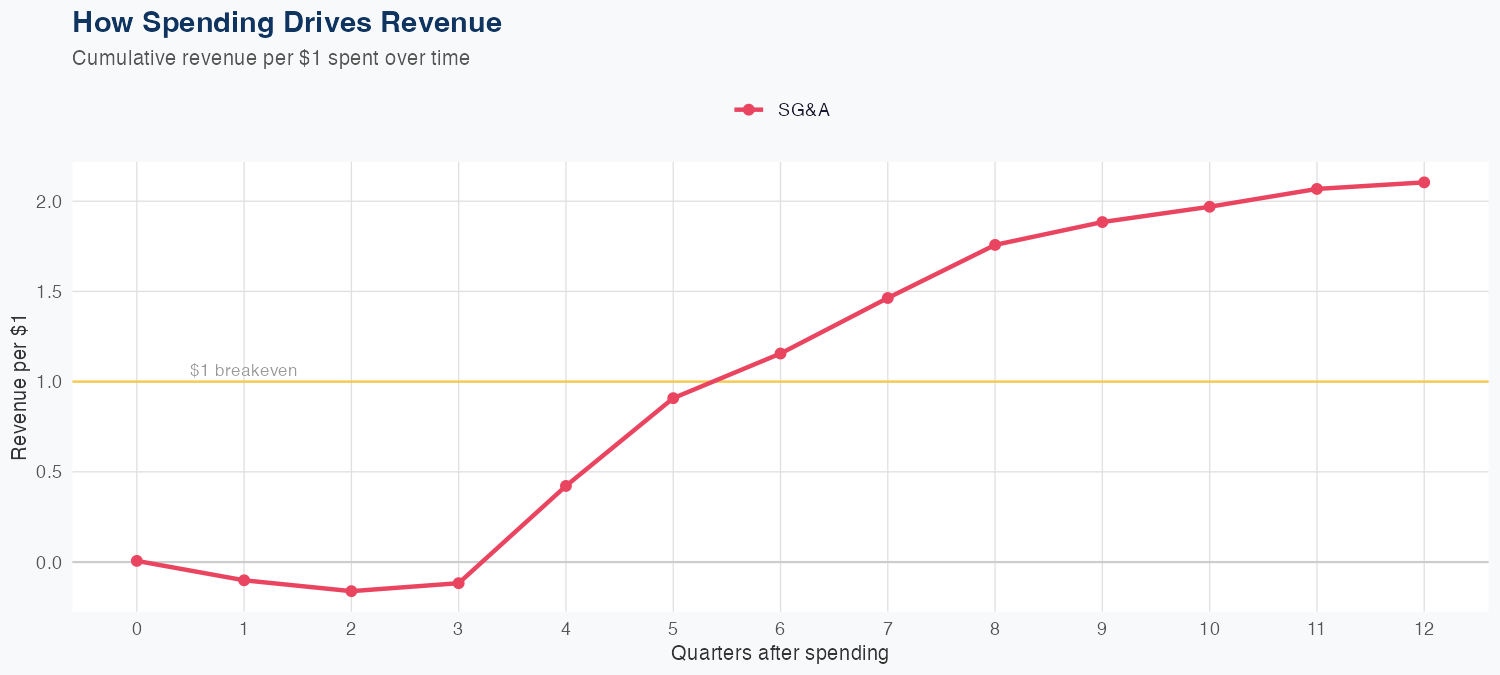
Revenue is largely driven by SG&A efficiency, with the model implying that each dollar of SG&A spending yields about $2.10 of long-run revenue, based on 24 quarters of linear data. The model achieves 5.3% MAPE and on holdout testing predicted 206M versus actual 212M, a 2.6% error, indicating credible short-term forecasting. The FY revenue forecast is 763M, down 4.4% year over year. Investors should note the strong SG&A ROI supports revenue generation even as the year shows a modest top-line decline, making ongoing SG&A efficiency and other revenue sources key to sustaining growth.
Investment Thesis
The econometric model achieves strong accuracy (5.3% MAPE), suggesting Texas Pacific Land Corporation's revenue trajectory is well-characterized by its spending patterns. Each $1 of SG&A spending generates $2.10 in revenue, reflecting strong commercial efficiency.
Revenue Forecast
Quarterly Detail
| Quarter | Model Forecast | Actual | 95% Range | YoY Growth | Status |
|---|---|---|---|---|---|
| Q4 2025 | $206M | $212M | $185M – $227M | +10.9% | ✓ In range |
| Q2 2026 | $194M | $164M – $223M | -1.1% | ||
| Q3 2026 | $192M | $156M – $229M | +2.5% | ||
| Q4 2026 | $194M | $152M – $235M | -4.7% | ||
| Q1 2027 | $183M | $136M – $230M | -13.4% |
Seasonal Factors
| Fiscal Quarter | Seasonal Factor | vs Trend | Interpretation | Obs. |
|---|---|---|---|---|
| FQ1 (Sep–Nov) | 1.0154 | +1.5% | In line with trend | 5 |
| FQ2 (Dec–Feb) | 1.0262 | +2.6% | In line with trend | 5 |
| FQ3 (Mar–May) | 1.0137 | +1.4% | In line with trend | 5 |
| FQ4 (Jun–Aug) | 0.9818 | -1.8% | In line with trend | 5 |
How Spending Drives Revenue
Want this analysis for your portfolio?
I build custom revenue intelligence reports for investors and companies using SEC filing data, econometric modeling, and AI-powered insights.
Get in Touch