Twilio Inc. TWLO
Revenue Intelligence Report • 42 quarters of SEC filing data • Updated 2026-03-15
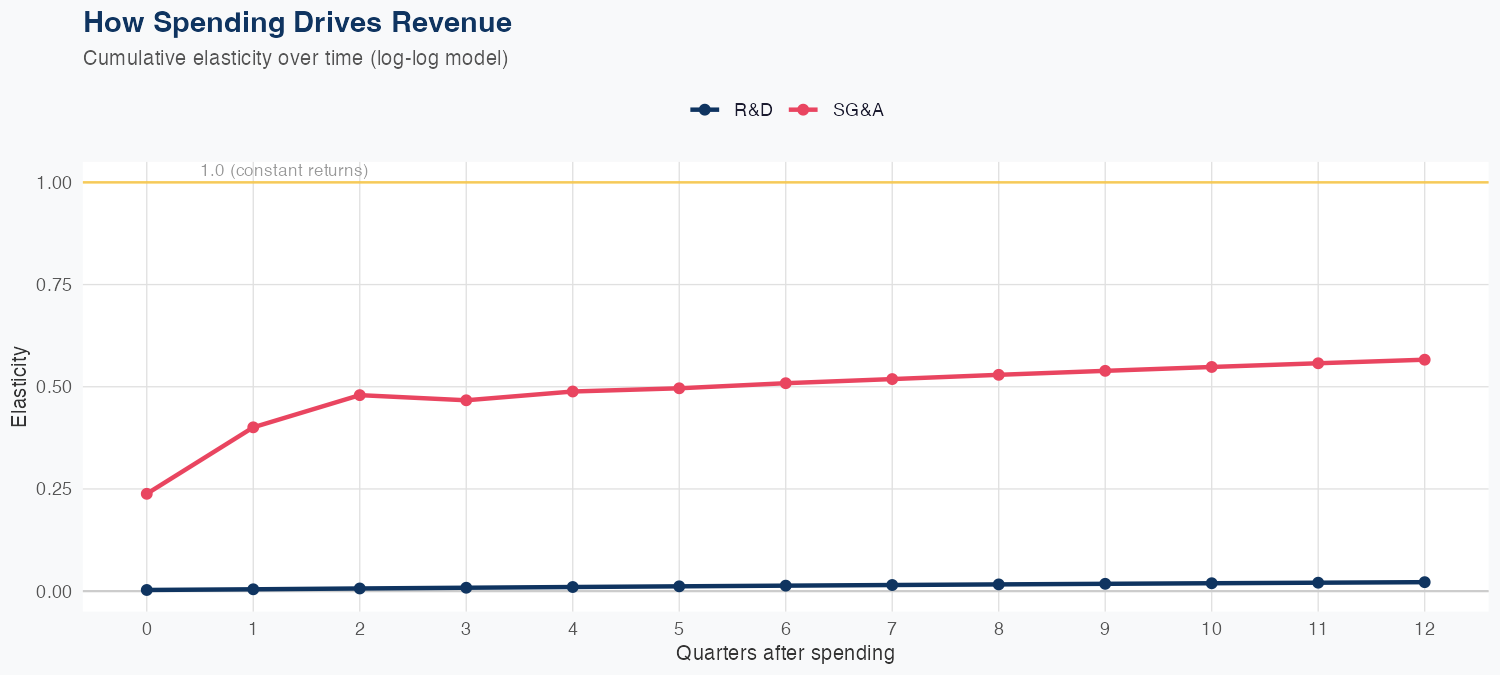
Revenue responds more to SG&A spending than to R&D, with a 1% increase in SG&A linked to about a 0.57% uplift in revenue, while 1% more R&D yields only about a 0.02% uplift. This suggests SG&A has the higher ROI for topline growth in this model, though both elasticities are modest, implying limited sensitivity and a need for tight efficiency. The model delivers 2.1% MAPE and a holdout forecast error of 3.0% (predicted 1.3B vs actual 1.4B), indicating reasonable forecast reliability. For the full year, revenue is projected to 5.6B, about 10% above the prior year, signaling solid growth but with emphasis on SG&A-driven expansion rather than large leaps in R&D; investors should monitor SG&A efficiency to sustain gains and margin resilience.
Investment Thesis
Our ARDL model tracks Twilio Inc.'s revenue with exceptional precision (2.1% MAPE), indicating highly predictable cash flows. R&D investment shows a 0.02x multiplier — each 1% increase in R&D spend is associated with a 0.02% revenue increase, signaling strong innovation-to-revenue conversion. Sales & marketing spend shows a 0.57x elasticity, suggesting effective go-to-market execution.
Revenue Forecast
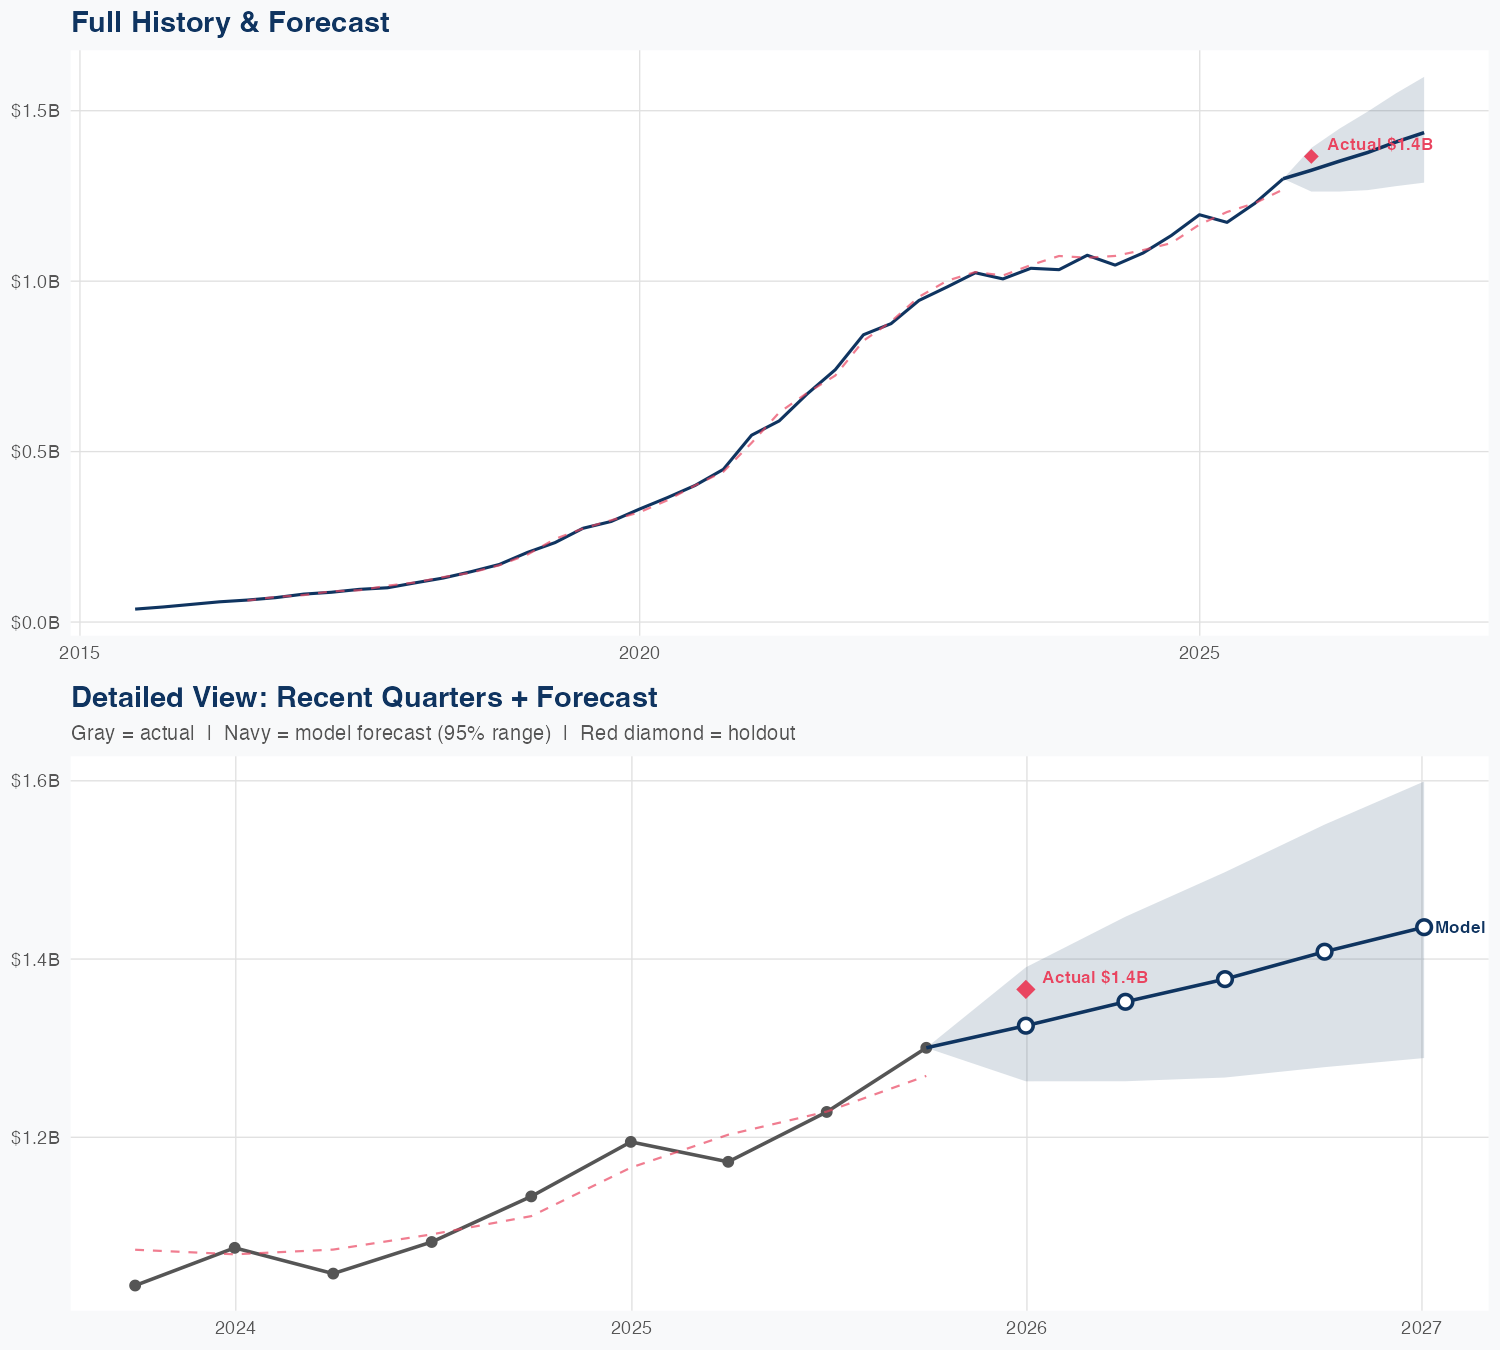
Quarterly Detail
| Quarter | Model Forecast | Actual | 95% Range | YoY Growth | Status |
|---|---|---|---|---|---|
| Q4 2025 | $1.3B | $1.4B | $1.3B – $1.4B | +10.9% | ✓ In range |
| Q2 2026 | $1.4B | $1.3B – $1.4B | +15.3% | ||
| Q3 2026 | $1.4B | $1.3B – $1.5B | +12.1% | ||
| Q4 2026 | $1.4B | $1.3B – $1.6B | +8.3% | ||
| Q1 2027 | $1.4B | $1.3B – $1.6B | +5.1% |
Seasonal Factors
| Fiscal Quarter | Seasonal Factor | vs Trend | Interpretation | Obs. |
|---|---|---|---|---|
| FQ1 (Sep–Nov) | 1.0137 | +1.4% | In line with trend | 10 |
| FQ2 (Dec–Feb) | 1.0248 | +2.5% | In line with trend | 10 |
| FQ3 (Mar–May) | 0.9749 | -2.5% | In line with trend | 9 |
| FQ4 (Jun–Aug) | 0.9997 | -0.0% | In line with trend | 10 |
How Spending Drives Revenue
Want this analysis for your portfolio?
I build custom revenue intelligence reports for investors and companies using SEC filing data, econometric modeling, and AI-powered insights.
Get in Touch