Venture Global, Inc. VG
Revenue Intelligence Report • 8 quarters of SEC filing data • Updated 2026-03-15
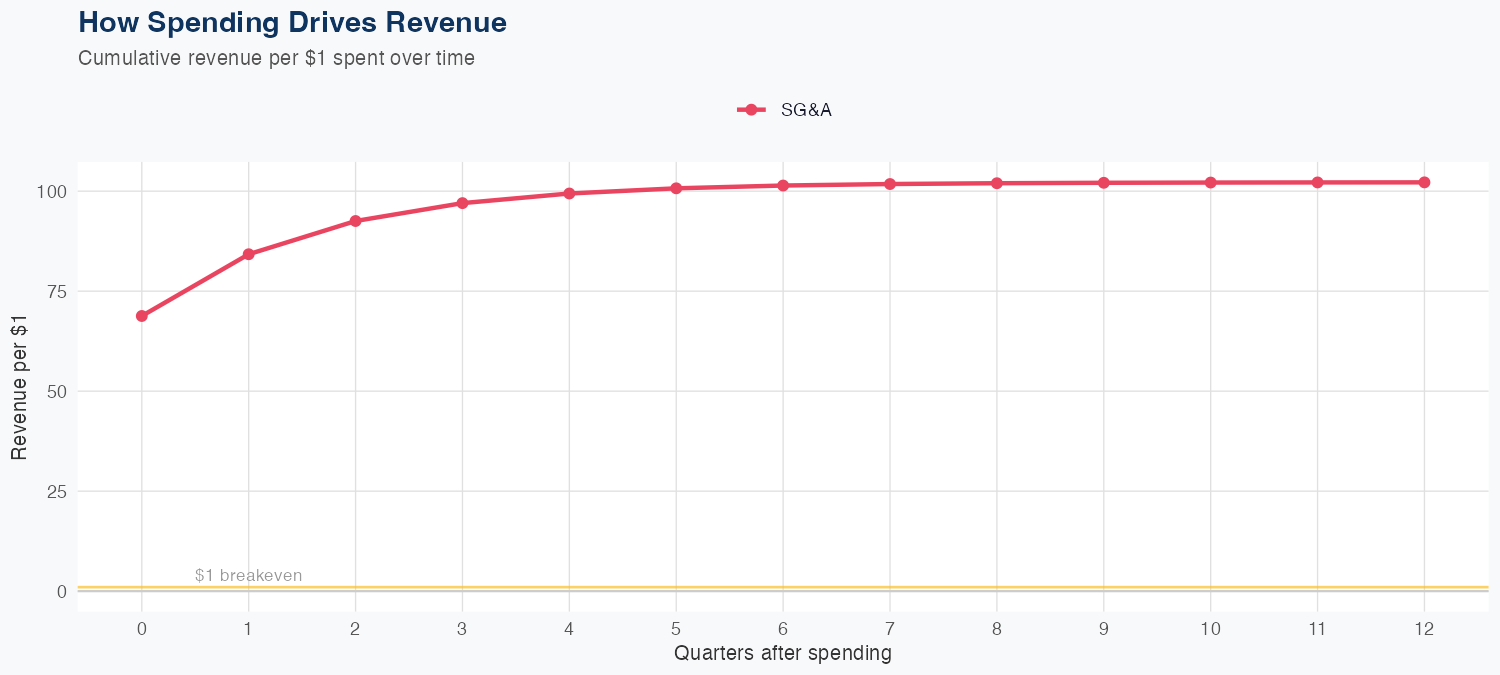
Revenue growth appears driven by a scalable top-line, with the model implying SG&A spending is highly productive: each $1 of SG&A yields $102.20 in long-run revenue, indicating a strong ROI on selling and general expenses. R&D data is not available, so its contribution cannot be quantified. The modeling approach is linear, achieving 2.4% MAPE across eight quarters, with a holdout test showing 4.2B predicted vs 4.4B actual (6.5% error), indicating reasonable predictive accuracy. The FY forecast calls for about $23B in revenue, up 69.3% year over year, signaling a robust growth outlook underpinned by efficient SG&A performance and strong demand.
Investment Thesis
Our ARDL model tracks Venture Global, Inc.'s revenue with exceptional precision (2.4% MAPE), indicating highly predictable cash flows. Each $1 of SG&A spending generates $102.20 in revenue, reflecting strong commercial efficiency.
Revenue Forecast
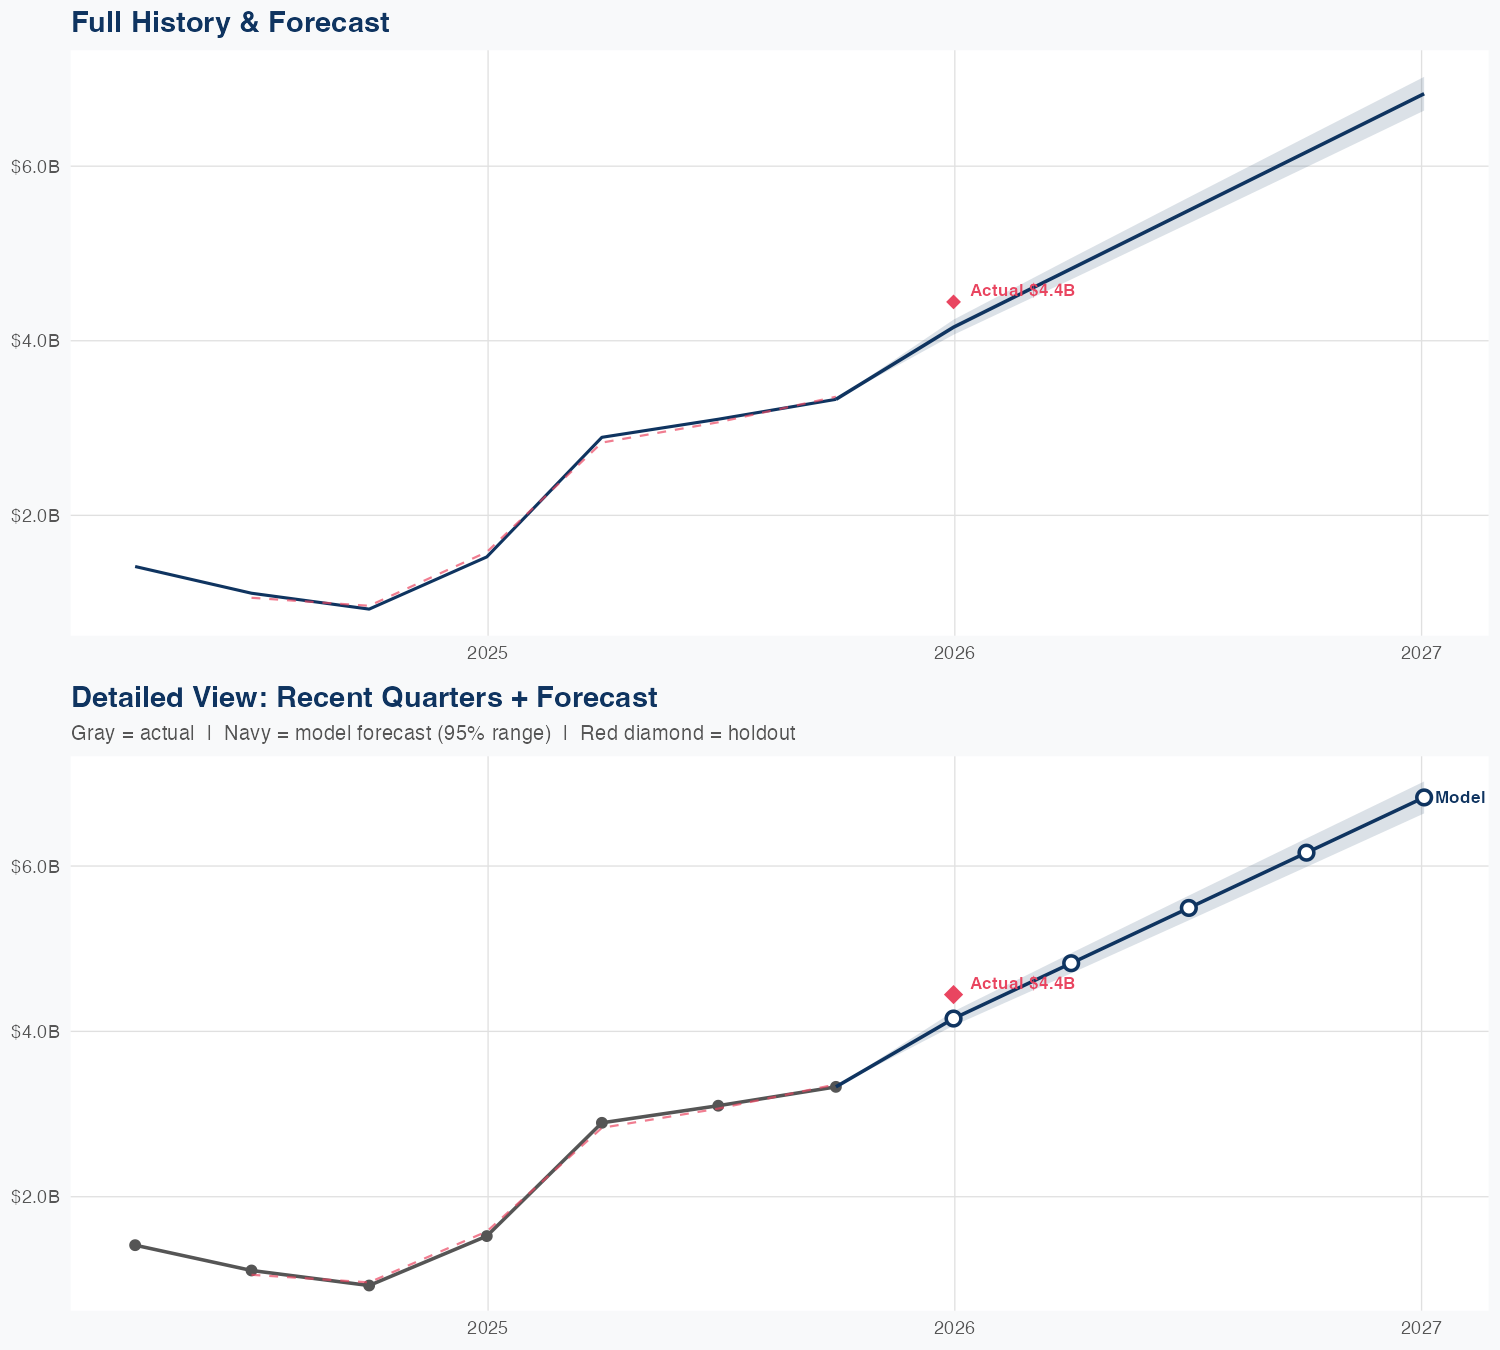
Quarterly Detail
| Quarter | Model Forecast | Actual | 95% Range | YoY Growth | Status |
|---|---|---|---|---|---|
| Q4 2025 | $4.2B | $4.4B | $4.1B – $4.2B | +172.7% | ✗ Outside range |
| Q2 2026 | $4.8B | $4.7B – $4.9B | +66.7% | ||
| Q3 2026 | $5.5B | $5.3B – $5.6B | +77.1% | ||
| Q4 2026 | $6.2B | $6.0B – $6.3B | +85.1% | ||
| Q1 2027 | $6.8B | $6.6B – $7.0B | +53.7% |
How Spending Drives Revenue
Want this analysis for your portfolio?
I build custom revenue intelligence reports for investors and companies using SEC filing data, econometric modeling, and AI-powered insights.
Get in Touch