Vici Properties Inc. VICI
Revenue Intelligence Report • 33 quarters of SEC filing data • Updated 2026-03-15
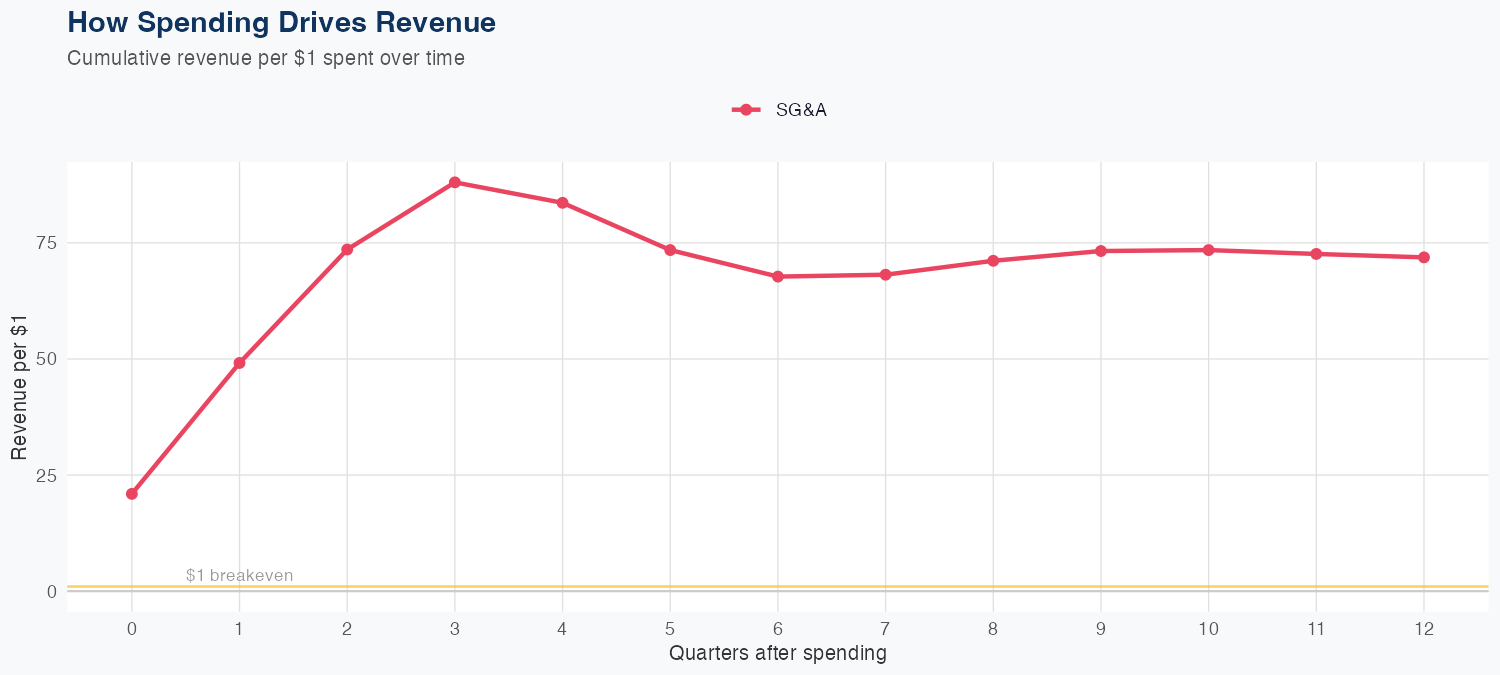
Revenue is driven by the scale of VICI's property portfolio, with the model attributing outsized revenue impact to SG&A spending: $1 of SG&A is projected to generate $71.88 of long-run revenue. The model's holdout test yielded a predicted $0.9B against actual $1.0B (7.1% error), and overall MAPE of 4.7%, indicating reasonable predictive power with some room for refinement. Latest quarterly revenue was $1.013B, while the full-year forecast stands at $3.9B, a 2.4% year-over-year decline, signaling a modestly softer revenue trajectory. Investors should monitor SG&A utilization and portfolio performance to confirm that the high implied ROI translates into sustainable revenue growth.
Investment Thesis
The econometric model achieves strong accuracy (4.7% MAPE), suggesting Vici Properties Inc.'s revenue trajectory is well-characterized by its spending patterns. Each $1 of SG&A spending generates $71.88 in revenue, reflecting strong commercial efficiency.
Revenue Forecast
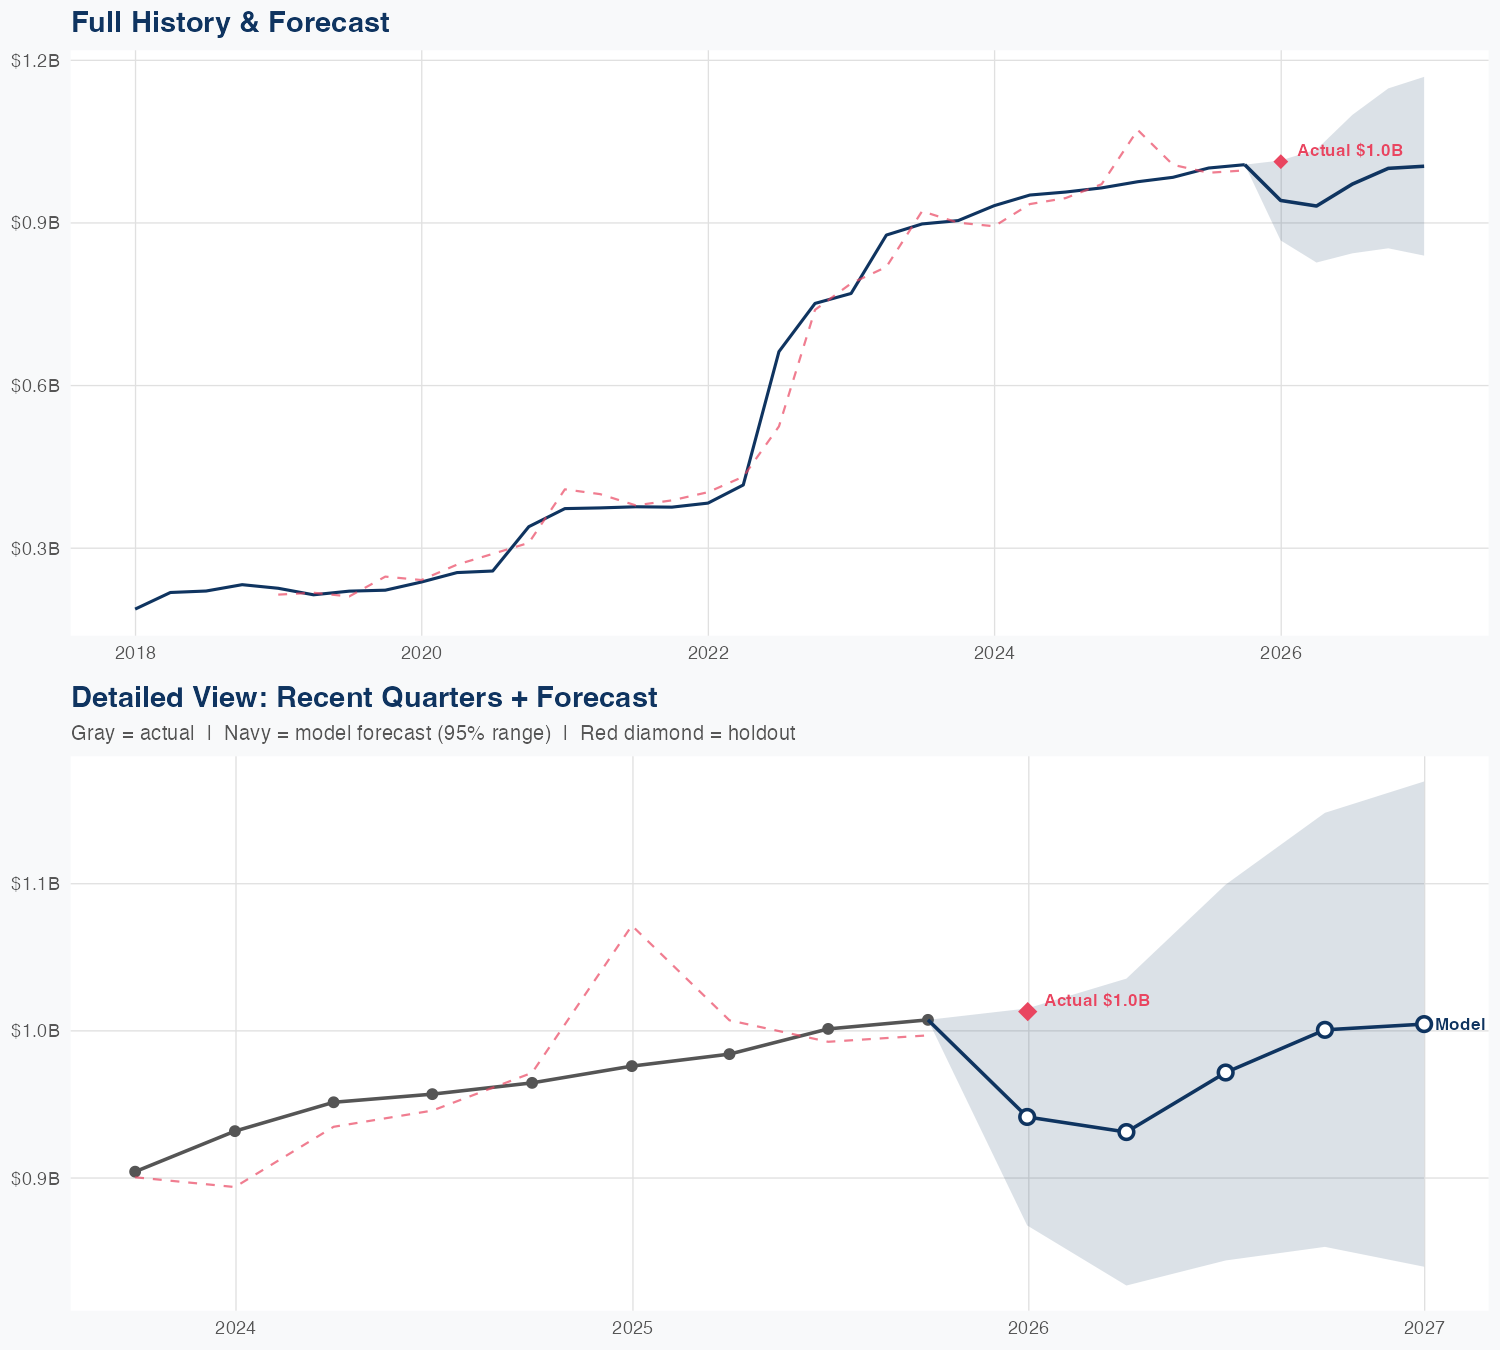
Quarterly Detail
| Quarter | Model Forecast | Actual | 95% Range | YoY Growth | Status |
|---|---|---|---|---|---|
| Q4 2025 | $0.9B | $1.0B | $0.9B – $1.0B | -3.5% | ✓ In range |
| Q2 2026 | $0.9B | $0.8B – $1.0B | -5.4% | ||
| Q3 2026 | $1.0B | $0.8B – $1.1B | -3.0% | ||
| Q4 2026 | $1.0B | $0.9B – $1.1B | -0.7% | ||
| Q4 2026 | $1.0B | $0.8B – $1.2B | -0.8% |
Seasonal Factors
| Fiscal Quarter | Seasonal Factor | vs Trend | Interpretation | Obs. |
|---|---|---|---|---|
| FQ1 (Sep–Nov) | 1.0042 | +0.4% | In line with trend | 7 |
| FQ2 (Dec–Feb) | 0.9847 | -1.5% | In line with trend | 8 |
| FQ3 (Mar–May) | 0.9772 | -2.3% | In line with trend | 7 |
| FQ4 (Jun–Aug) | 1.0088 | +0.9% | In line with trend | 7 |
How Spending Drives Revenue
Want this analysis for your portfolio?
I build custom revenue intelligence reports for investors and companies using SEC filing data, econometric modeling, and AI-powered insights.
Get in Touch