Ventas, Inc. VTR
Revenue Intelligence Report • 70 quarters of SEC filing data • Updated 2026-03-15
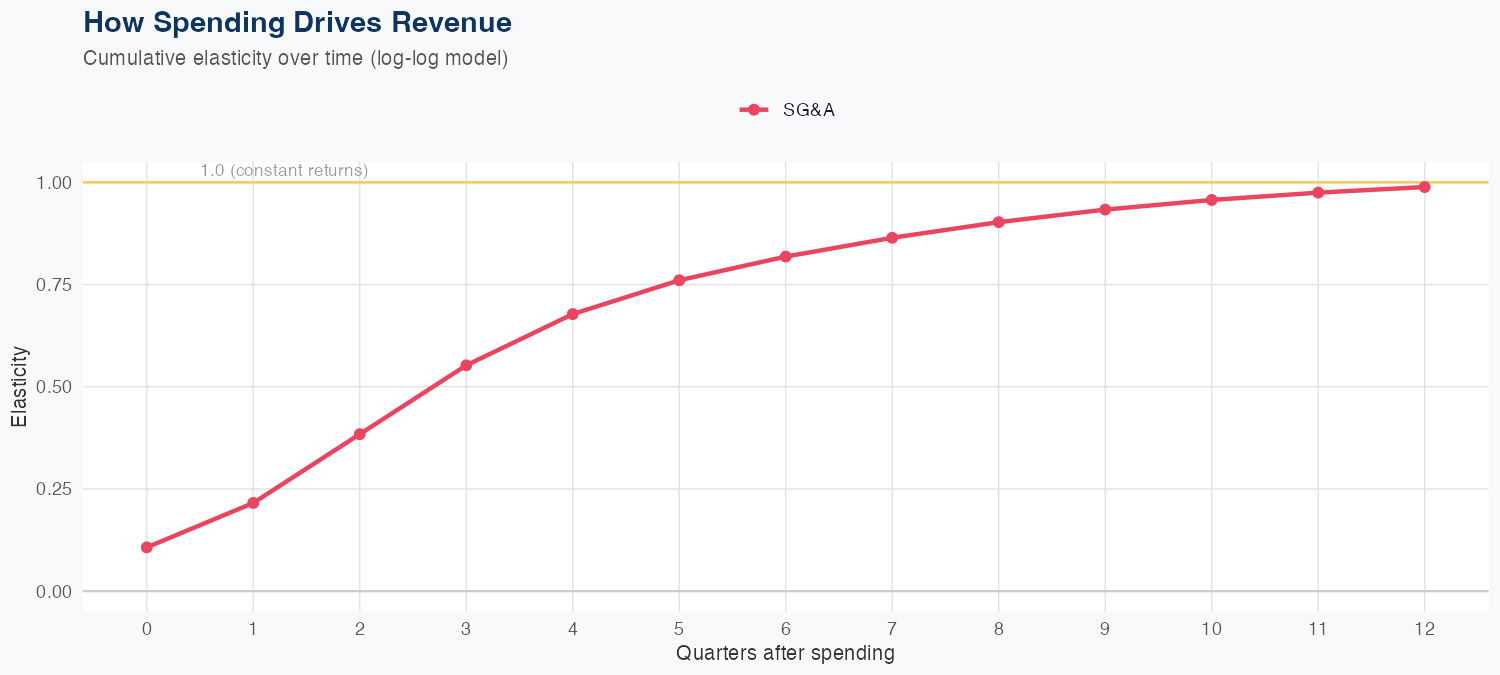
Revenue appears driven primarily by SG&A spending, with near-unit elasticity: a 1% increase in SG&A yields about a 0.99% increase in revenue, indicating SG&A is the main lever for topline growth. The model, based on a log-log framework, shows solid predictive power with 3.5% MAPE and a holdout error of 5.5% (predicted $1.50B vs actual $1.60B). The FY outlook calls for roughly $5.6B in revenue, about 4.2% lower year over year, signaling near-term headwinds despite a long data history of 70 quarters. Given the near-unit elasticity of SG&A, ROI on SG&A spend is expected to be proportional, suggesting marginal spending increases translate to similar gains in revenue, though investors should brace for continued revenue pressure in the near term.
Investment Thesis
The econometric model achieves strong accuracy (3.5% MAPE), suggesting Ventas, Inc.'s revenue trajectory is well-characterized by its spending patterns. Sales & marketing spend shows a 0.99x elasticity, suggesting effective go-to-market execution.
Revenue Forecast
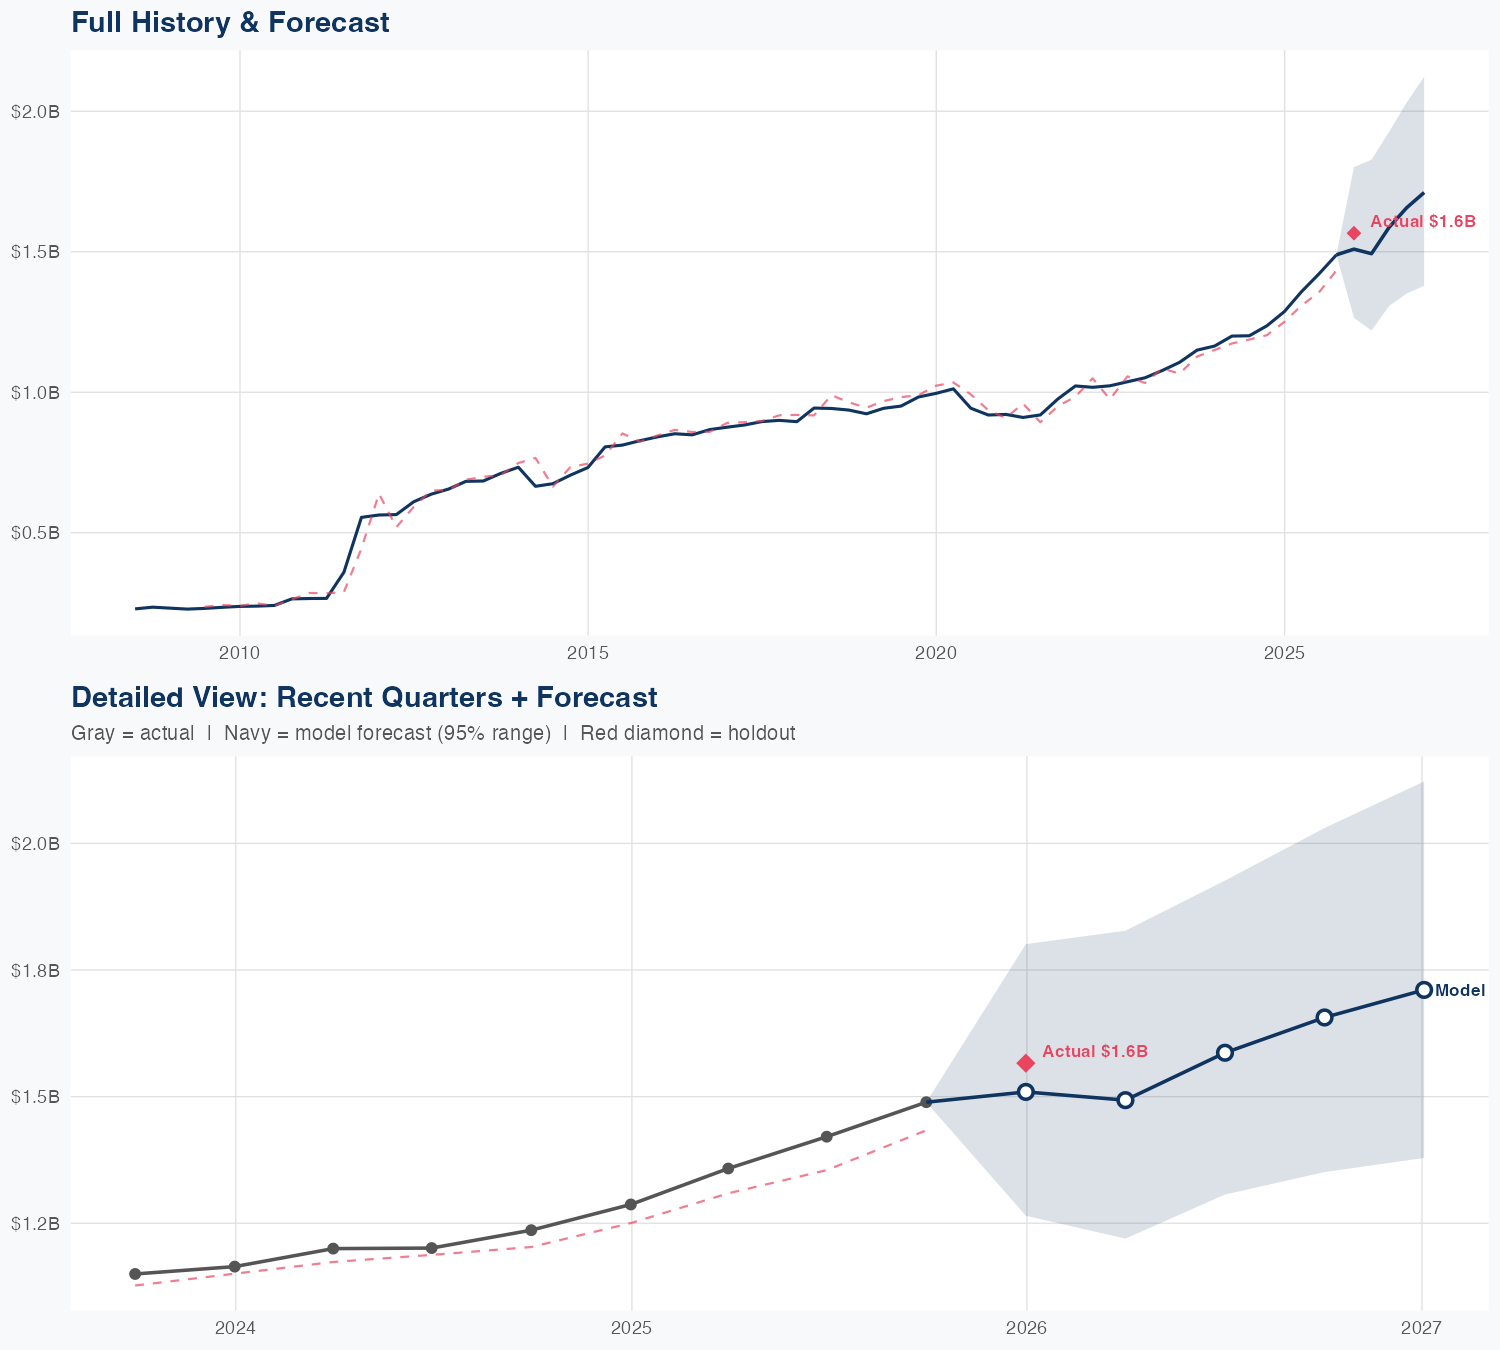
Quarterly Detail
| Quarter | Model Forecast | Actual | 95% Range | YoY Growth | Status |
|---|---|---|---|---|---|
| Q4 2025 | $1.5B | $1.6B | $1.3B – $1.6B | +15.0% | ✓ In range |
| Q2 2026 | $1.4B | $1.2B – $1.7B | +4.8% | ||
| Q3 2026 | $1.4B | $1.2B – $1.7B | -2.3% | ||
| Q4 2026 | $1.4B | $1.1B – $1.7B | -7.0% | ||
| Q1 2027 | $1.4B | $1.1B – $1.8B | -10.9% |
Seasonal Factors
| Fiscal Quarter | Seasonal Factor | vs Trend | Interpretation | Obs. |
|---|---|---|---|---|
| FQ1 (Sep–Nov) | 1.0048 | +0.5% | In line with trend | 17 |
| FQ2 (Dec–Feb) | 0.9909 | -0.9% | In line with trend | 17 |
| FQ3 (Mar–May) | 0.989 | -1.1% | In line with trend | 16 |
| FQ4 (Jun–Aug) | 1.0046 | +0.5% | In line with trend | 17 |
How Spending Drives Revenue
Want this analysis for your portfolio?
I build custom revenue intelligence reports for investors and companies using SEC filing data, econometric modeling, and AI-powered insights.
Get in Touch