Yum! Brands, Inc. YUM
Revenue Intelligence Report • 65 quarters of SEC filing data • Updated 2026-03-15
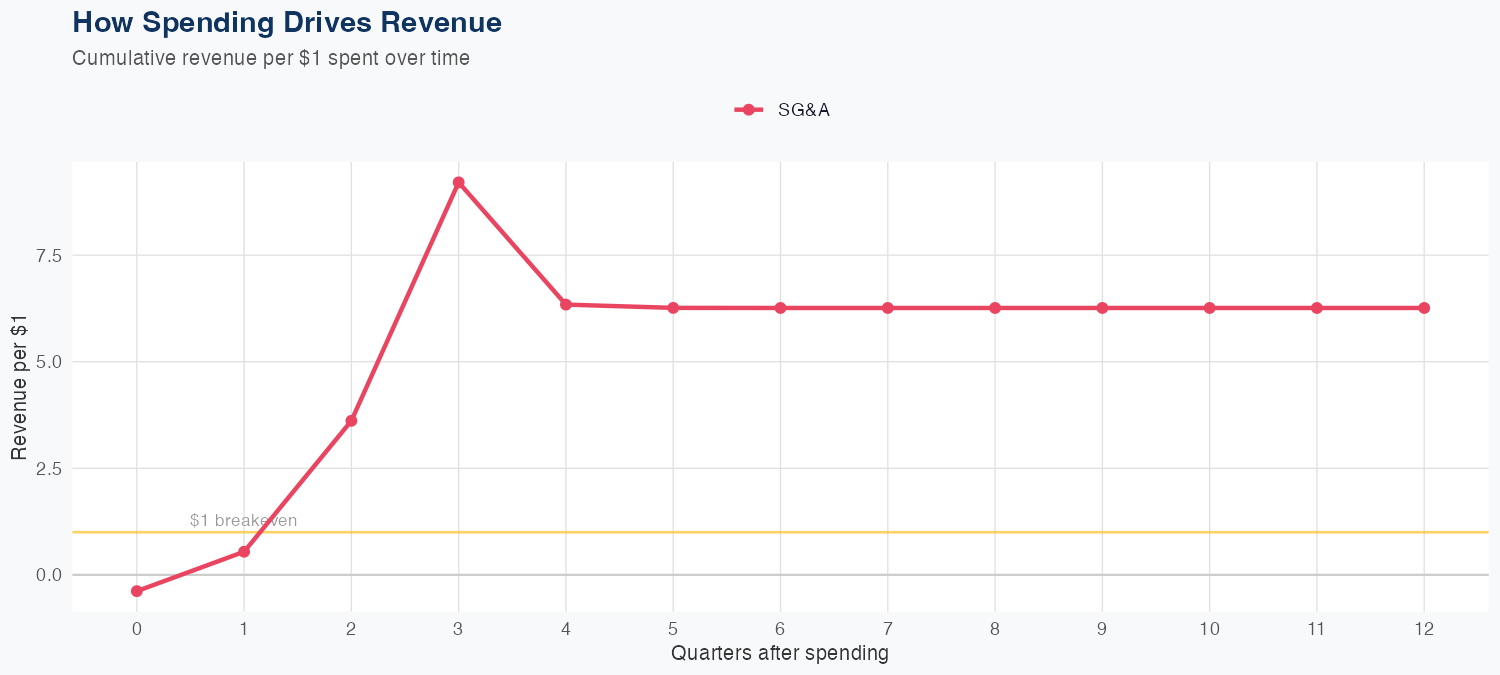
Revenue appears driven by SG&A spending, with the long-run revenue impact estimated at $6.26 for every $1 of SG&A. The model is linear but delivers poor accuracy: MAPE 234.8%, and a holdout test error of 31.2% (predicted $1.7B vs actual $2.5B). Latest quarterly revenue is $2.515B. For the full year, the forecast is $7.1B, a 13.3% decline year over year, signaling a cautious outlook despite the SG&A ROI signal.
Investment Thesis
At 234.8% MAPE, the model captures Yum! Brands, Inc.'s broad revenue trajectory, though quarterly variability suggests sensitivity to external factors. Each $1 of SG&A spending generates $6.26 in revenue, reflecting strong commercial efficiency.
Revenue Forecast
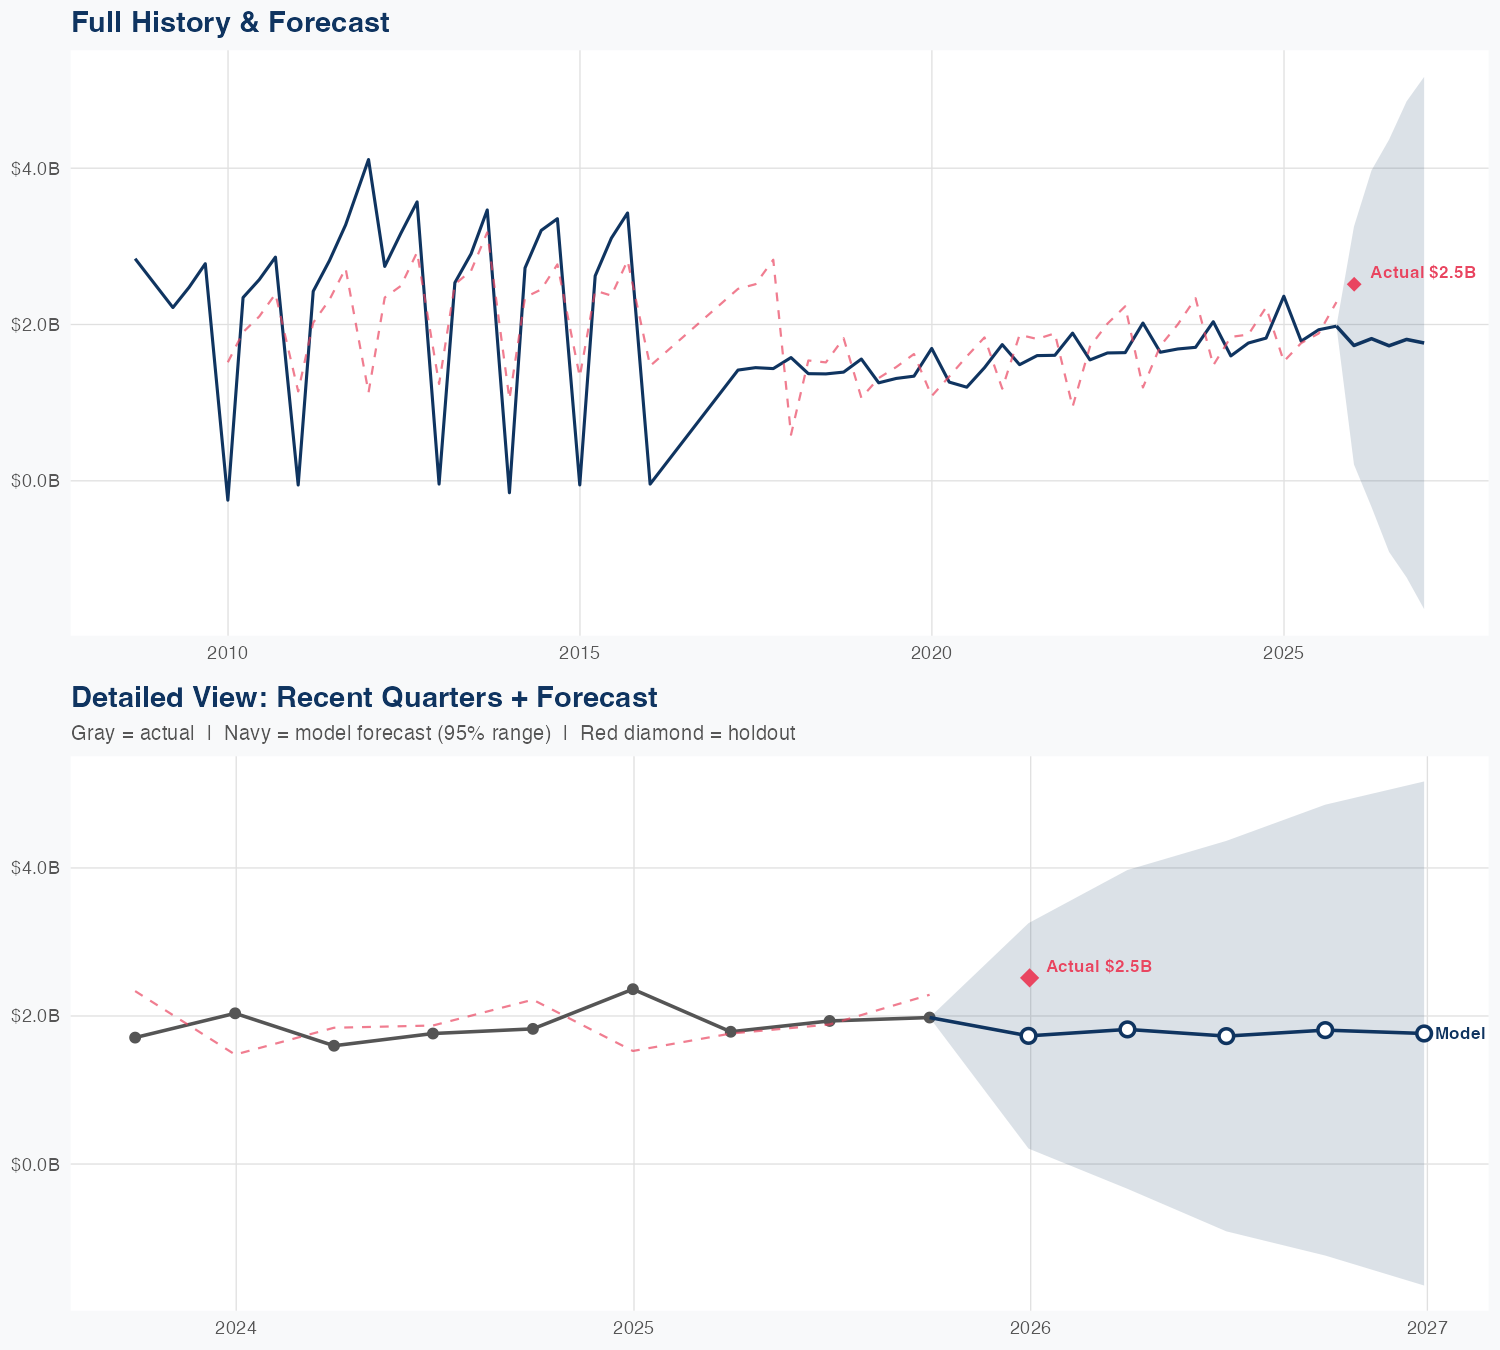
Quarterly Detail
| Quarter | Model Forecast | Actual | 95% Range | YoY Growth | Status |
|---|---|---|---|---|---|
| Q4 2025 | $1.7B | $2.5B | $0.2B – $3.3B | -26.7% | ✓ In range |
| Q1 2026 | $1.8B | $-0.3B – $4.0B | +1.8% | ||
| Q2 2026 | $1.7B | $-0.9B – $4.4B | -10.6% | ||
| Q3 2026 | $1.8B | $-1.2B – $4.9B | -8.6% | ||
| Q4 2026 | $1.8B | $-1.6B – $5.2B | -29.9% |
Seasonal Factors
| Fiscal Quarter | Seasonal Factor | vs Trend | Interpretation | Obs. |
|---|---|---|---|---|
| FQ1 (Sep–Nov) | 0.8513 | -14.9% | -14.9% below trend | 15 |
| FQ2 (Dec–Feb) | 1.4786 | +47.9% | +47.9% above trend | 16 |
| FQ3 (Mar–May) | 0.954 | -4.6% | -4.6% below trend | 15 |
| FQ4 (Jun–Aug) | 0.9422 | -5.8% | -5.8% below trend | 15 |
How Spending Drives Revenue
Want this analysis for your portfolio?
I build custom revenue intelligence reports for investors and companies using SEC filing data, econometric modeling, and AI-powered insights.
Get in Touch