Where the money goes in AI
A customer pays for an AI tool. The model provider pays its cloud bill. The cloud operator buys chips, hires builders and pays for power. Follow those payments far enough and the money can come back around. A cloud operator can also invest in the lab that buys its compute.
Read each arrow from payer to recipient. A cloud operator connects the customer’s AI bill to the companies that finance and build the infrastructure.
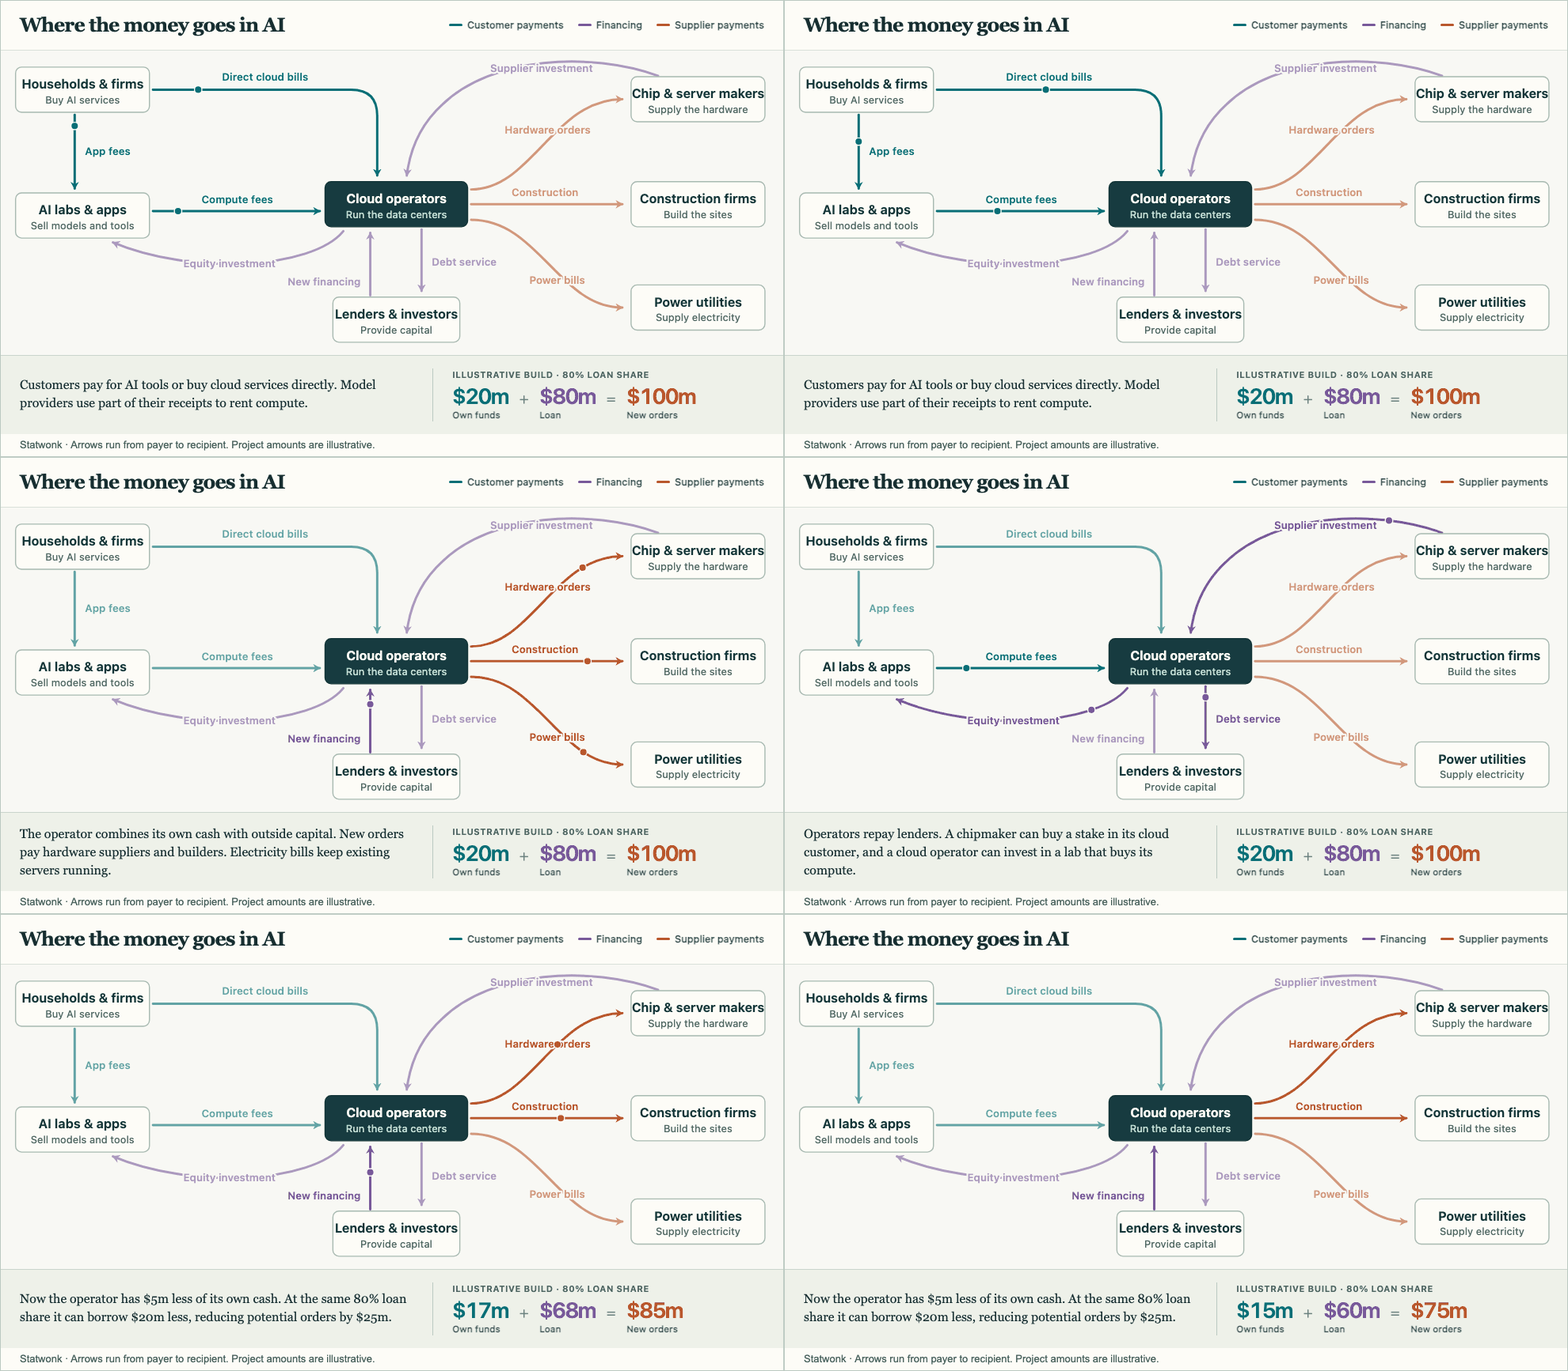
The investment arrow can run in either direction along the supply chain. Amazon invested in Anthropic, which buys compute from AWS. Chip supplier NVIDIA also bought $2 billion of stock in a cloud operator that uses its hardware. A customer payment and an equity purchase put cash in the recipient’s hands for different reasons. Only the former pays for a product or service. Amazon’s investment · NVIDIA’s investment
How one missed payment can shrink the next order
Suppose a cloud operator collects $5 million less from customers than expected. Even if demand for its next cluster holds up, it now has less cash to put toward the build. If a lender covers 80% of eligible project costs and the operator supplies the rest, losing $5 million of its own money takes another $20 million of borrowing off the table. A chipmaker or builder can see $25 million disappear from a potential order.
This is one way to see the financial accelerator. In Bernanke, Gertler and Gilchrist’s model, a borrower with less net worth faces a higher financing premium for the same project. At a fixed expected return relative to the safe rate, the value of capital it chooses is proportional to its net worth, QK = ψ(s)N. The animation uses a simpler contract to make that relationship visible. If a loan covers a share a of cost and the down payment binds, each dollar of the operator’s funds supports 1 / (1 − a) dollars of orders. The 80% share is illustrative. Bernanke, Gertler and Gilchrist, eq. 3.8
How much could the platforms pay for themselves?
For Alphabet, Amazon, Meta and Microsoft, compare cash generated by operations with cash paid for property and equipment in the same September quarter a year apart. The filings cover each company’s whole business, including advertising, retail and other activities. They let us measure the cash available to these AI buildouts, although they do not break out AI-only purchases.
In 2025, each of the four generated enough operating cash to cover those purchases. A year later, three spent more than they generated. For each company, the amount to cover from other sources is max(0, purchases − operating cash). It can come from cash already on hand, asset sales, debt or new equity.
Quarterly figures and sources
| Company filing | 2025 | 2026 | ||
|---|---|---|---|---|
| Operating cash | Purchases | Operating cash | Purchases | |
| Alphabet | 48,414 | 23,953 | 42,290 | 51,355 |
| Amazon | 35,525 | 35,095 | 42,422 | 77,259 |
| Meta | 29,999 | 18,829 | 32,786 | 33,942 |
| Microsoft | 45,057 | 19,394 | 58,000 | 39,367 |
Purchases are gross cash outlays for property and equipment, before asset-sale proceeds. Noncash lease additions and lease principal payments are excluded. Operating cash is after operating expenses and before dividends and buybacks. The calculation compares two flows in one quarter and does not identify the financing source for individual purchases.
The three companies with shortfalls needed $45.1 billion beyond that quarter’s operating cash to sustain their purchases. Pool all four first and the gap looks like just $26.4 billion. The missing $18.6 billion was operating cash left over at the fourth company after its own purchases. For that money to support anyone else’s chip order, it has to cross a company boundary. That is why the loan, investment and customer-payment arrows matter even when the industry as a whole generates plenty of cash.