Apache Incubator: Graduation rate
Statwonk
August 21, 2016
At Zapier, we love open-source software. A little over a year ago we started using AirBnB’s Airflow data pipeline tool. We used the tool to share SQL queries, but have since graduated to writing data pipeline DAGs and managing data science jobs. Airflow monitors the success / failure state of DAGs and allows backfilling from immutable data sources when jobs fail. Being able to compose jobs is a huge step beyond our previous cron setup and we expect to gain huge leverage from Airflow.
That’s why we were excited to find out the project was accepted to Apache’s Incubator March 2016.
Naturally, we wondered what the likelihood of graduation to full-fledged Apache project might be?
The graph below is an application of the Kaplan-Meier Estimator that estimates a project’s survival function. A survival function (\(S(t) = P[T > t]\) where t is time) is a representation of the likelihood of some death event (graduation in this case) given birth (entering the incubator). The inverse of the survival function (\(1 - S(t) = F(t)\)) is the cumulative probability mass function. This function represents the probability of death (graduation) by some point in time.
I like to make guesses before I see data. This helps avoid confirmation bias and exposes more clearly where the data are surprising. In this case, I expected most projects would graduate within two years. That’s not the case.
By year two about 19 percent of projects graduate (+ / - 8.2% @ 2 * standard error). By year three the number jumps to 33 percent (+ / - 10%). It takes until year four to reach beyond 50 percent (~ 54%) probability of graduation.
The graduation process is slower than I expected, but by year five the probability of graduation approaches 70 percent.
## Call: survfit(formula = Surv(time_to_graduation/52.1429, graduated) ~
##     1, data = .)
##
##  time n.risk n.event survival std.err lower 95% CI upper 95% CI
##     1     95      11    0.913  0.0252        0.865        0.964
##     2     62       9    0.808  0.0399        0.733        0.890
##     3     37       9    0.674  0.0530        0.577        0.786
##     4     16       9    0.475  0.0681        0.358        0.629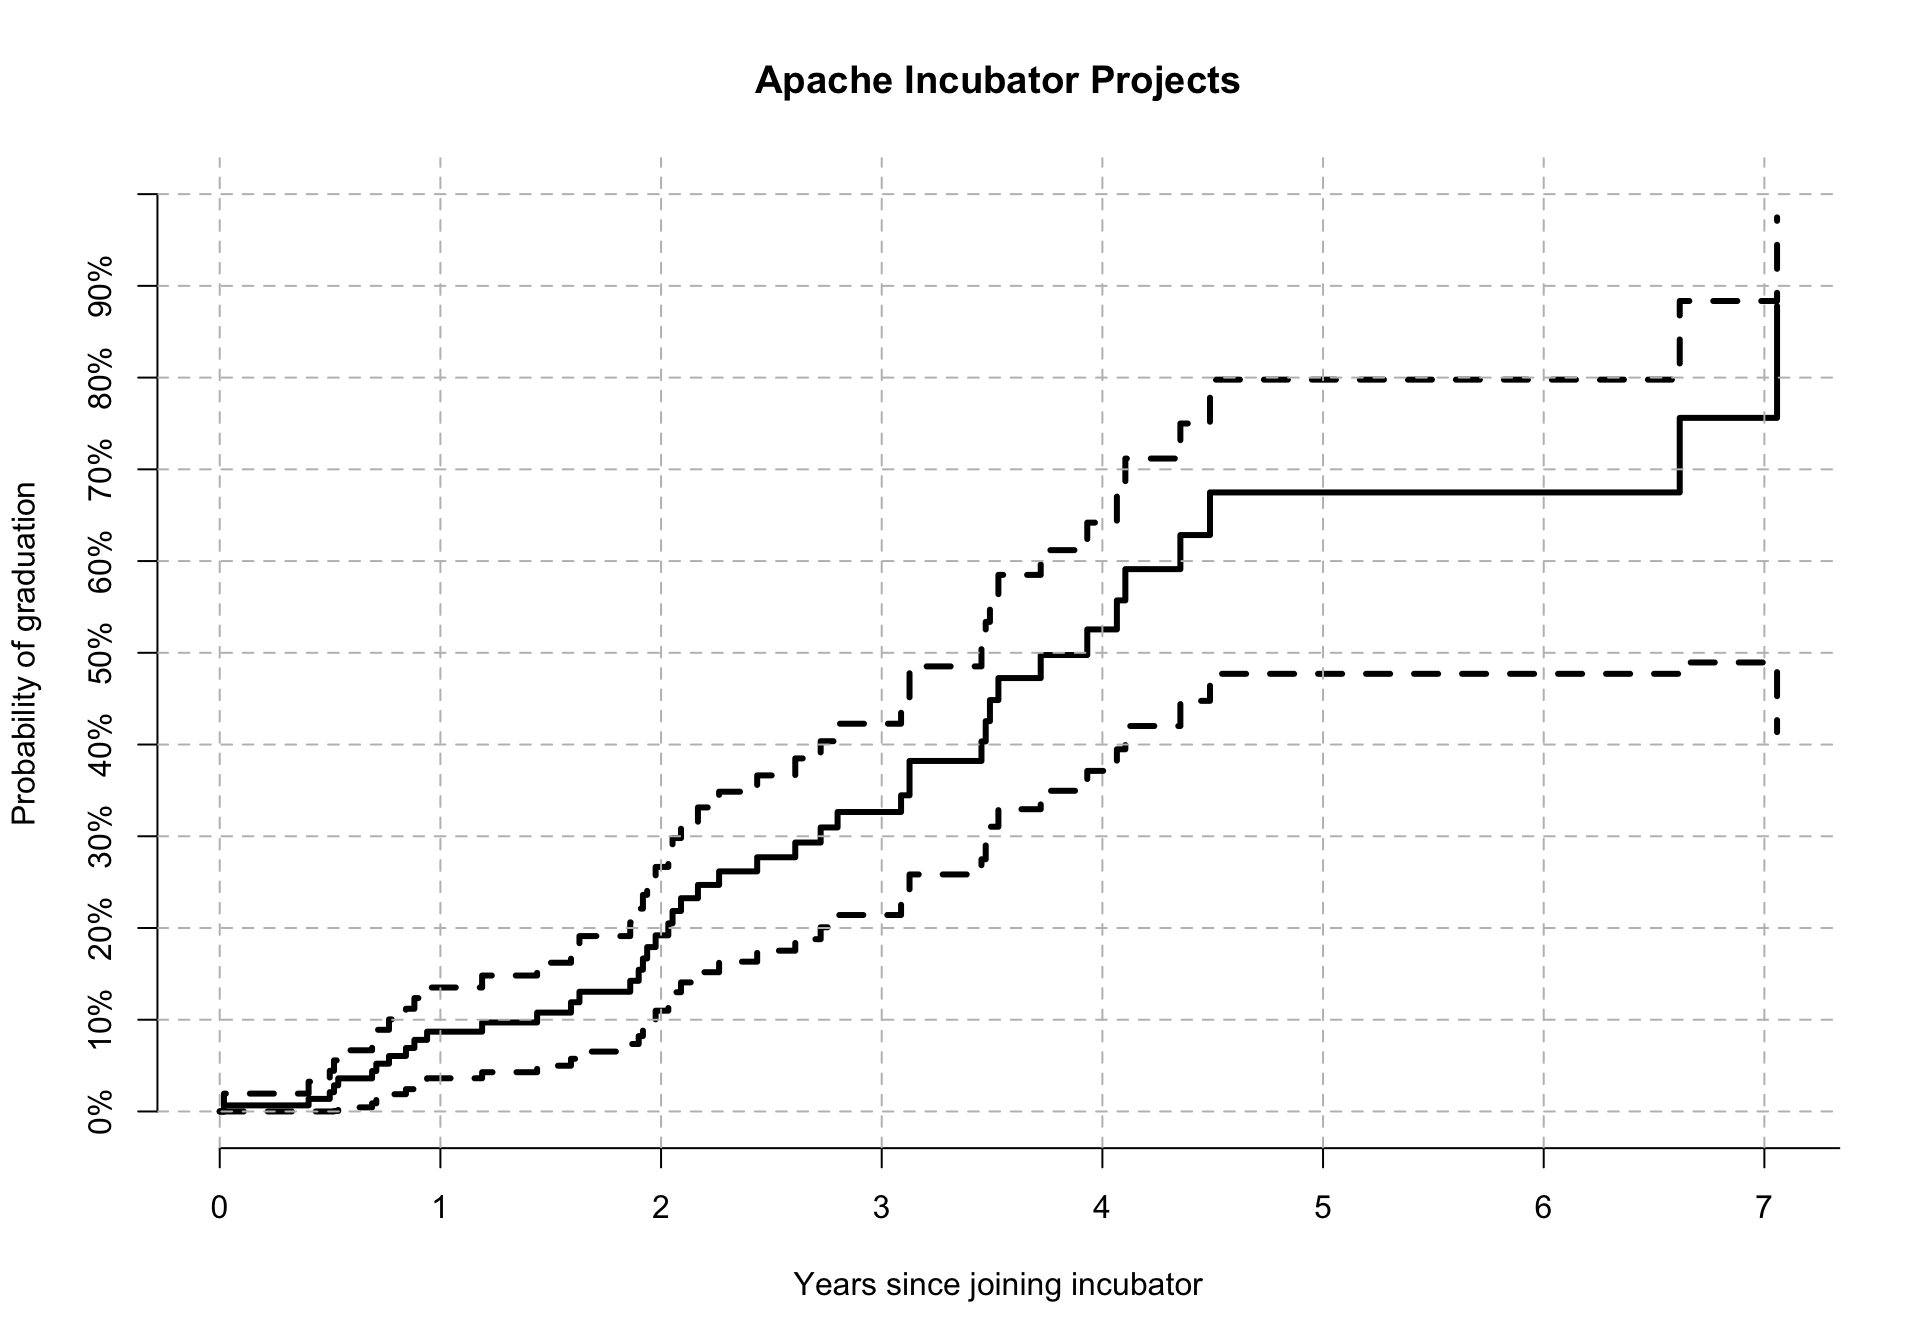
# install.packages('rvest')
# library(help = "rvest")
library(rvest) # for scraping http://incubator.apache.org/projects/
library(dplyr) # for munging and calculations
library(survival) # for estimating the survival curve (1 - F(t))

scrape_incubator_table <- function(xpath) {
  read_html("http://incubator.apache.org/projects/") %>%
    html_nodes(xpath = xpath) %>%
    html_table() %>% { .[[1]] } %>% tbl_df()
}

scrape_incubator_table("/html/body/div/div[3]/div[2]/div[2]/table") %>%
  mutate(`Start Date` = as.POSIXct(`Start Date`),
         group = "Current projects",
         graduated = 0) %>%
  bind_rows(
    scrape_incubator_table("/html/body/div/div[3]/div[2]/div[4]/table") %>%
      mutate(`Start Date` = as.POSIXct(`Start Date`),
             `End Date` = ifelse(nchar(`End Date`) == 7, paste0(`End Date`, "-15"), `End Date`),
             `End Date` = as.POSIXct(`End Date`),
             group = "Graduated projects",
             graduated = 1),
    scrape_incubator_table("/html/body/div/div[3]/div[2]/div[4]/table") %>%
      mutate(`Start Date` = as.POSIXct(`Start Date`)) %>%
      mutate(`End Date` = ifelse(nchar(`End Date`) == 7, paste0(`End Date`, "-15"), `End Date`),
             `End Date` = as.POSIXct(`End Date`),
             group = "Retired projects",
             graduated = 0)) %>%
  mutate(time_to_graduation = ifelse(!is.na(`End Date`),
                                     difftime(`End Date`, `Start Date`, units = "weeks"),
                                     difftime(Sys.time(), `Start Date`, units = "weeks")),
         time_to_graduation = as.integer(time_to_graduation)) %>%
  survfit(Surv(time_to_graduation / 52.1429, graduated) ~ 1, data = .) %>%
  plot(fun = "event", axes = FALSE, ylim = c(0, 1),
       ylab = "Probability of graduation",
       xlab = "Years since joining incubator",
       main = "Apache Incubator Projects",
       lwd = 3)
axis(2, at = seq(0, 1, 0.1), labels = scales::percent(seq(0, 1, 0.1)))
axis(1, at = seq(0, by = 1, length.out = 10))
abline(h = seq(0, 1, 0.1), lty = "dashed", col = "gray")
abline(v = seq(0, by = 1, length.out = 10), lty = "dashed", col = "gray")
There are a few extensions I could see for this analysis. It’d be interesting to estimate the graduation rate as a function of voting, or year having joined. Is graduation speeding up or slowing down? Given a project’s age, what’s the probability of graduating within the next year? Analyses for another day …
I’d like to finish up by offering a big “thank you” to the Apache Software Foundation. The Foundation has a great reputation for fostering the development of open-source software. The benefit to the world is surely great and not measureable. Thank you (contributors) for all you do!
P.S. - If you’re looking for a job, we’re hiring at Zapier. We’d love it if you’d apply.