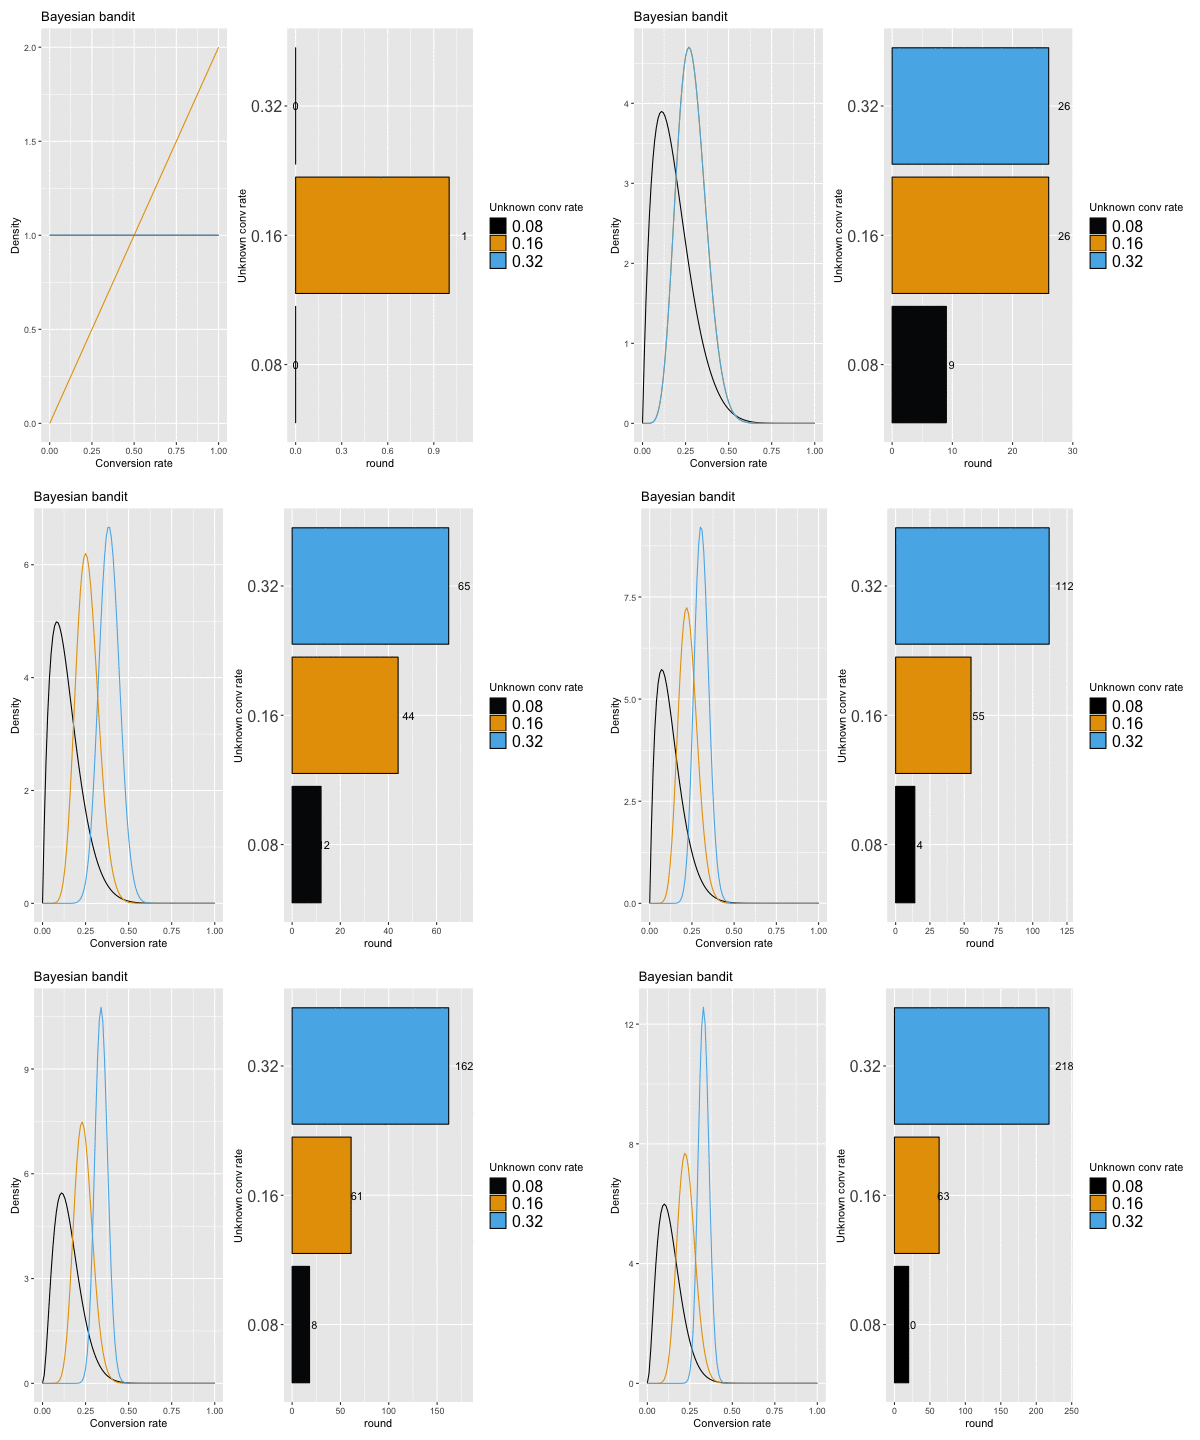
A simple Bayesian bandit
“Bayesian bandit” is the common name given to the idea of using a Bayesian updating procedure to continuously exploit information collected from an operating environment. This is in contrast to a “one-shot” A/B test in which exploration and exploitation steps are sequential.
library(tidyverse)## ── Attaching packages ───────────────────────────────────────────────────────────────────────────────────────────────────────────────────── tidyverse 1.2.1 ──## ✔ ggplot2 3.1.0 ✔ purrr 0.3.1
## ✔ tibble 2.0.1 ✔ dplyr 0.8.0.1
## ✔ tidyr 0.8.3 ✔ stringr 1.4.0
## ✔ readr 1.1.1 ✔ forcats 0.3.0## ── Conflicts ──────────────────────────────────────────────────────────────────────────────────────────────────────────────────────── tidyverse_conflicts() ──
## ✖ dplyr::filter() masks stats::filter()
## ✖ dplyr::lag() masks stats::lag()library(patchwork)
library(ggthemes)
library(animation)
# brew install imagemagick
# check with: convert -v
set.seed(0)
knitr::opts_chunk$set(fig.width = 12, fig.height = 8, fig.retina = TRUE) perform_bandit_round <- function(x) {
x %>%
mutate(draw = pmap_dbl(
.l = list(oracle_conv_rates, x = outcome, y = round),
function(x, y, ...) { rbeta(1, x + 1, y - x + 1) })) %>%
filter(draw == max(draw)) %>%
mutate(outcome = rbinom(1, 1, oracle_conv_rates),
round = round + 1) %>%
select(-draw) %>%
bind_rows(x) %>%
group_by(group, oracle_conv_rates, overall_round) %>%
summarise(outcome = sum(outcome, na.rm = TRUE),
round = max(round, na.rm = TRUE)) %>%
ungroup() %>%
mutate(obs_conv_rate = outcome / round,
overall_round = overall_round + 1)
}
(tibble(oracle_conv_rates = c(0.08, 0.16, 0.32)) %>%
mutate(group = factor(oracle_conv_rates),
outcome = 0,
round = 0) %>%
mutate(overall_round = 0) %>%
perform_bandit_round() -> x)seq_len(3e2) %>%
accumulate(function(x, i) {
perform_bandit_round(x) %>%
mutate(overall_round = i + 1)
}, .init = x) %>%
bind_rows() %>%
ungroup() -> all_rounds
saveGIF({
for(i in 1:length(unique(all_rounds$overall_round))) {
all_rounds %>%
filter(overall_round == !!i) %>%
{
(.) -> x
beta_shapes <- function(i) {
list(shape1 = 1 + x[i,]$outcome,
shape2 = 1 + x[i,]$round - x[i,]$outcome)
}
p1 <- ggplot(data = tibble(x = c(0, 1)), aes(x = x)) +
stat_function(fun = dbeta, args = beta_shapes(1), color = "#000000") +
stat_function(fun = dbeta, args = beta_shapes(2), color = "#E69F00") +
stat_function(fun = dbeta, args = beta_shapes(3), color = "#56B4E9") +
labs(x = "Conversion rate", y = "Density") +
ggtitle("Bayesian bandit")
p2 <- x %>%
ggplot(aes(x = factor(group), fill = factor(group))) +
geom_bar(aes(y = round), stat = "identity", color = "black") +
geom_text(aes(label = round, y = round*1.1)) +
coord_flip() +
scale_fill_colorblind(name = "Unknown conv rate") +
labs(x = "Unknown conv rate") +
theme(legend.text = element_text(size = 16),
axis.text.y = element_text(size = 16))
print(p1 + p2)
}
}
},
movie.name = "bayesian_bandit.gif",
interval = 0.1, nmax = 20,
ani.width = 600)## Output at: bayesian_bandit.gif## [1] TRUE