What are the chances the Supreme Court sees turnover in the remaining portion of Trump’s first term?
Caveat emptor: I make a lot of assumptions to answer this question (during an afternoon recovering from a cold and hanging out with a toddler). Any analysis can be improved. If you like this one, copy the code and share improvements freely!
supreme_court_wiki_page <- read_html(
  "https://en.wikipedia.org/wiki/List_of_United_States_Supreme_Court_Justices_by_time_in_office")
First I’ll download the data and prepare if for analysis. I’d specifically like to answer the question: “what are the chances the Supreme Court sees turnover in the remaining portion of Trump’s first term?” … if the future plays out similar to the past. Note, for example, that this analysis currently assumes life expectencies are all the same among justices and other unreasonable things.
supreme_court_wiki_page %>%
  html_nodes("#justices") %>%
  html_table() %>%
  { .[[1]] } %>%
  tibble::as_tibble() %>%
  select(rank = Rank, justice = Justice, start_on = 4, end_on = 5) %>%
  mutate_at(vars(start_on, end_on),
            funs(as.POSIXct(., origin = "1970-01-01", format = "%B %d, %Y"))) %>%
  mutate(censor = ifelse(is.na(end_on), 0, 1),
         time_to = ifelse(censor == 1,
                          difftime(end_on, start_on, units = "days"),
                          difftime(Sys.time(), start_on, units = "days")),
         time_to = time_to/365.25) -> d
d %>%
survfit(Surv(time_to, censor) ~ 1, data = .) %>%
plot(main = "Supreme Court tenure durations",
xlab = "Years on Court",
ylab = "Chance still on Court")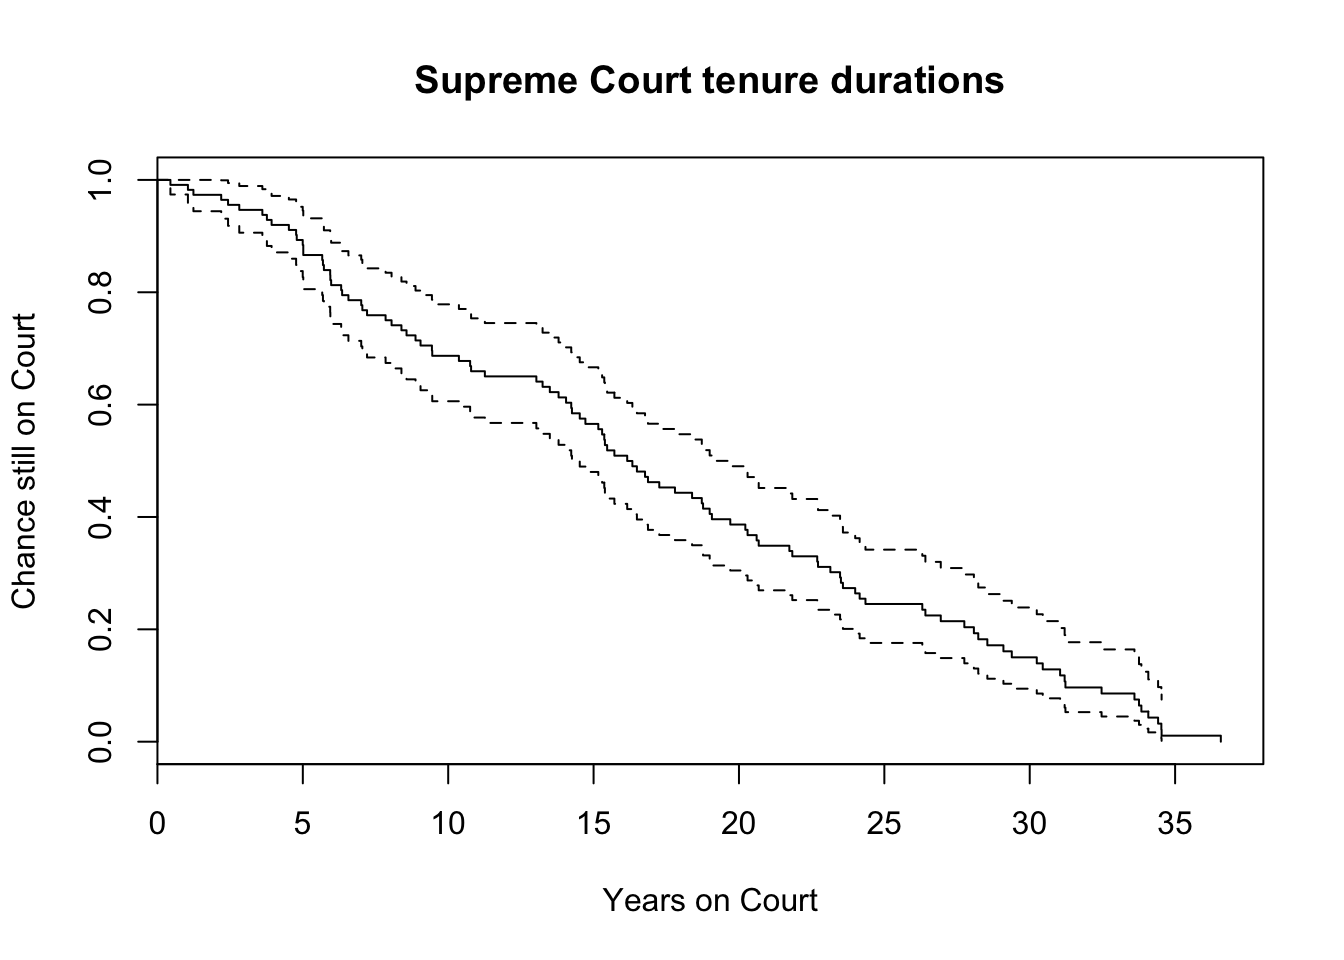
Let’s assume an independent weakest-link process using the Weibull distribution. The idea is that when each justice joins the Court, they start a set of timers. The timers have imaginary labels like, “for family,” “for a medical condition,” “retirement”, etc. If for each justice we observe the first of these timers ringing, then we have a Weibull process.
A visual inspection of the fit to data suggests this is a reasonable story.
d %>%
  select(time_to, censor) %>%
  mutate(left = time_to,
         right = ifelse(censor == 0, NA, left)) %>%
  as.data.frame() %>%
  fitdistrplus::fitdistcens(distr = "weibull") %>%
  plot()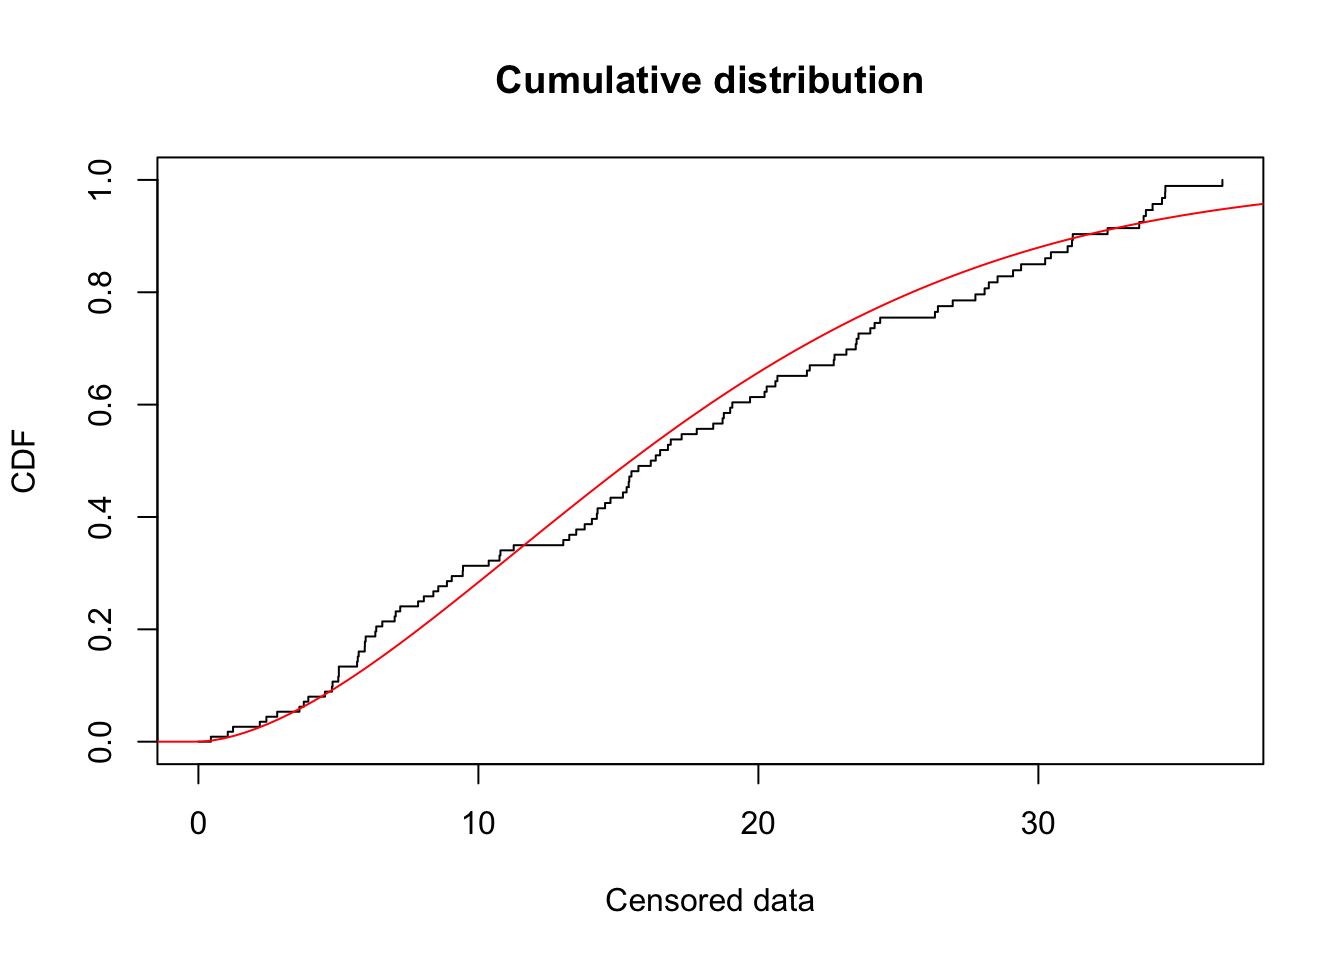
d %>%
  select(time_to, censor) %>%
  mutate(left = time_to,
         right = ifelse(censor == 0, NA, left)) %>%
  as.data.frame() %>%
fitdistrplus::fitdistcens(distr = "weibull") -> wfitwfit## Fitting of the distribution ' weibull ' on censored data by maximum likelihood
## Parameters:
## estimate
## shape 1.680964
## scale 19.203452
## Fixed parameters:
## data frame with 0 columns and 0 rowsd %>% filter(censor == 0) %>% rename(years = time_to)Time until next presidential election,
difftime(as.POSIXct("2020-11-03", origin = "1970-01-01"),
         Sys.time(),
         units = "days") %>%
  as.numeric() %>%
  { . / 365.25 }
## [1] 1.837955So we’re about 1.83 years until Trump’s ability to nominate a new justice closes without a new election (barring impeachment and removal from office!).
Let’s check the longest-serving member, Clarence Thomas’s chances of remaining through November 3rd, 2020:
chance_of_tenure_longer_than_x <- function(x) {
  pweibull(x, shape = 1.68, scale = 19.2, lower.tail = FALSE)
}

# This reads: P( chance Thomas tenure goes beyond next election )
(p <- chance_of_tenure_longer_than_x(27.2 + 1.83) / chance_of_tenure_longer_than_x(27.2))
## [1] 0.8125909(1/(1 - p))## [1] 5.335922Yikes, a one in five chance that Clarance Thomas’ tenure ends during Trump’s current term.
Okay, but there’s more than Thomas at-risk,
d %>%
  filter(censor == 0) %>%
  rename(Years = time_to) %>%
  mutate(`Chance tenure ends before election` = purrr::map_dbl(Years, function(x) {
    1 - (chance_of_tenure_longer_than_x(x + 1.83) / chance_of_tenure_longer_than_x(x))
  })) %>%
  select(-start_on, -end_on, -censor)
How about the chance that one of the justice’s tenures ends before the next election? To answer this we need to combine the chances of each individual justice. I’ll also assume the tenures are indepenedent (they’re not! This assumption isn’t very accurate).
d %>%
  filter(censor == 0) %>%
  mutate(chance_tenure_ends_before_election = purrr::map_dbl(time_to, function(x) {
    1 - (chance_of_tenure_longer_than_x(x + 1.83) / chance_of_tenure_longer_than_x(x))
  })) %>%
  mutate(tenure_ends_before_election = purrr::map(
    chance_tenure_ends_before_election, ~ rbinom(1e5, 1, .x))) %>%
  select(justice, tenure_ends_before_election) %>%
  tidyr::unnest() %>%
  group_by(justice) %>%
  mutate(sim = 1:n()) %>% ungroup() %>%
  group_by(sim) %>%
  summarise(justices_w_tenure_ending = sum(tenure_ends_before_election)) %>%
  count(chance_one_or_more_tenure_ends_before_election = justices_w_tenure_ending > 0) %>%
  mutate(p = n/sum(n)) %>%
  filter(chance_one_or_more_tenure_ends_before_election) %>%
  pull(p) %>%
  scales::percent()
## [1] "67.6%"Double yikes, there’s a better chance than not that another Supreme Court justice’s tenure ends before next election!