The Strait of Hormuz carries roughly one-fifth of the world's daily oil supply. When it constricts, the market's response is swift but not always rational. To separate structural price pressure from momentary panic, we fit a robust linear model (Huber M-estimator) to the daily transit and price data from the ongoing February–March 2026 crisis.
The Physical Reality
This morning's $126/bbl price spike was eye-catching, but the robust trend line tells a more disciplined story. The model predicts that at a single daily transit, Brent should sit near $104/bbl — roughly $22 below the observed panic price. The chart below uses a log-transformed x-axis to zoom in on the critical scarcity zone (0–5 transits), where the steepest price discovery occurs.
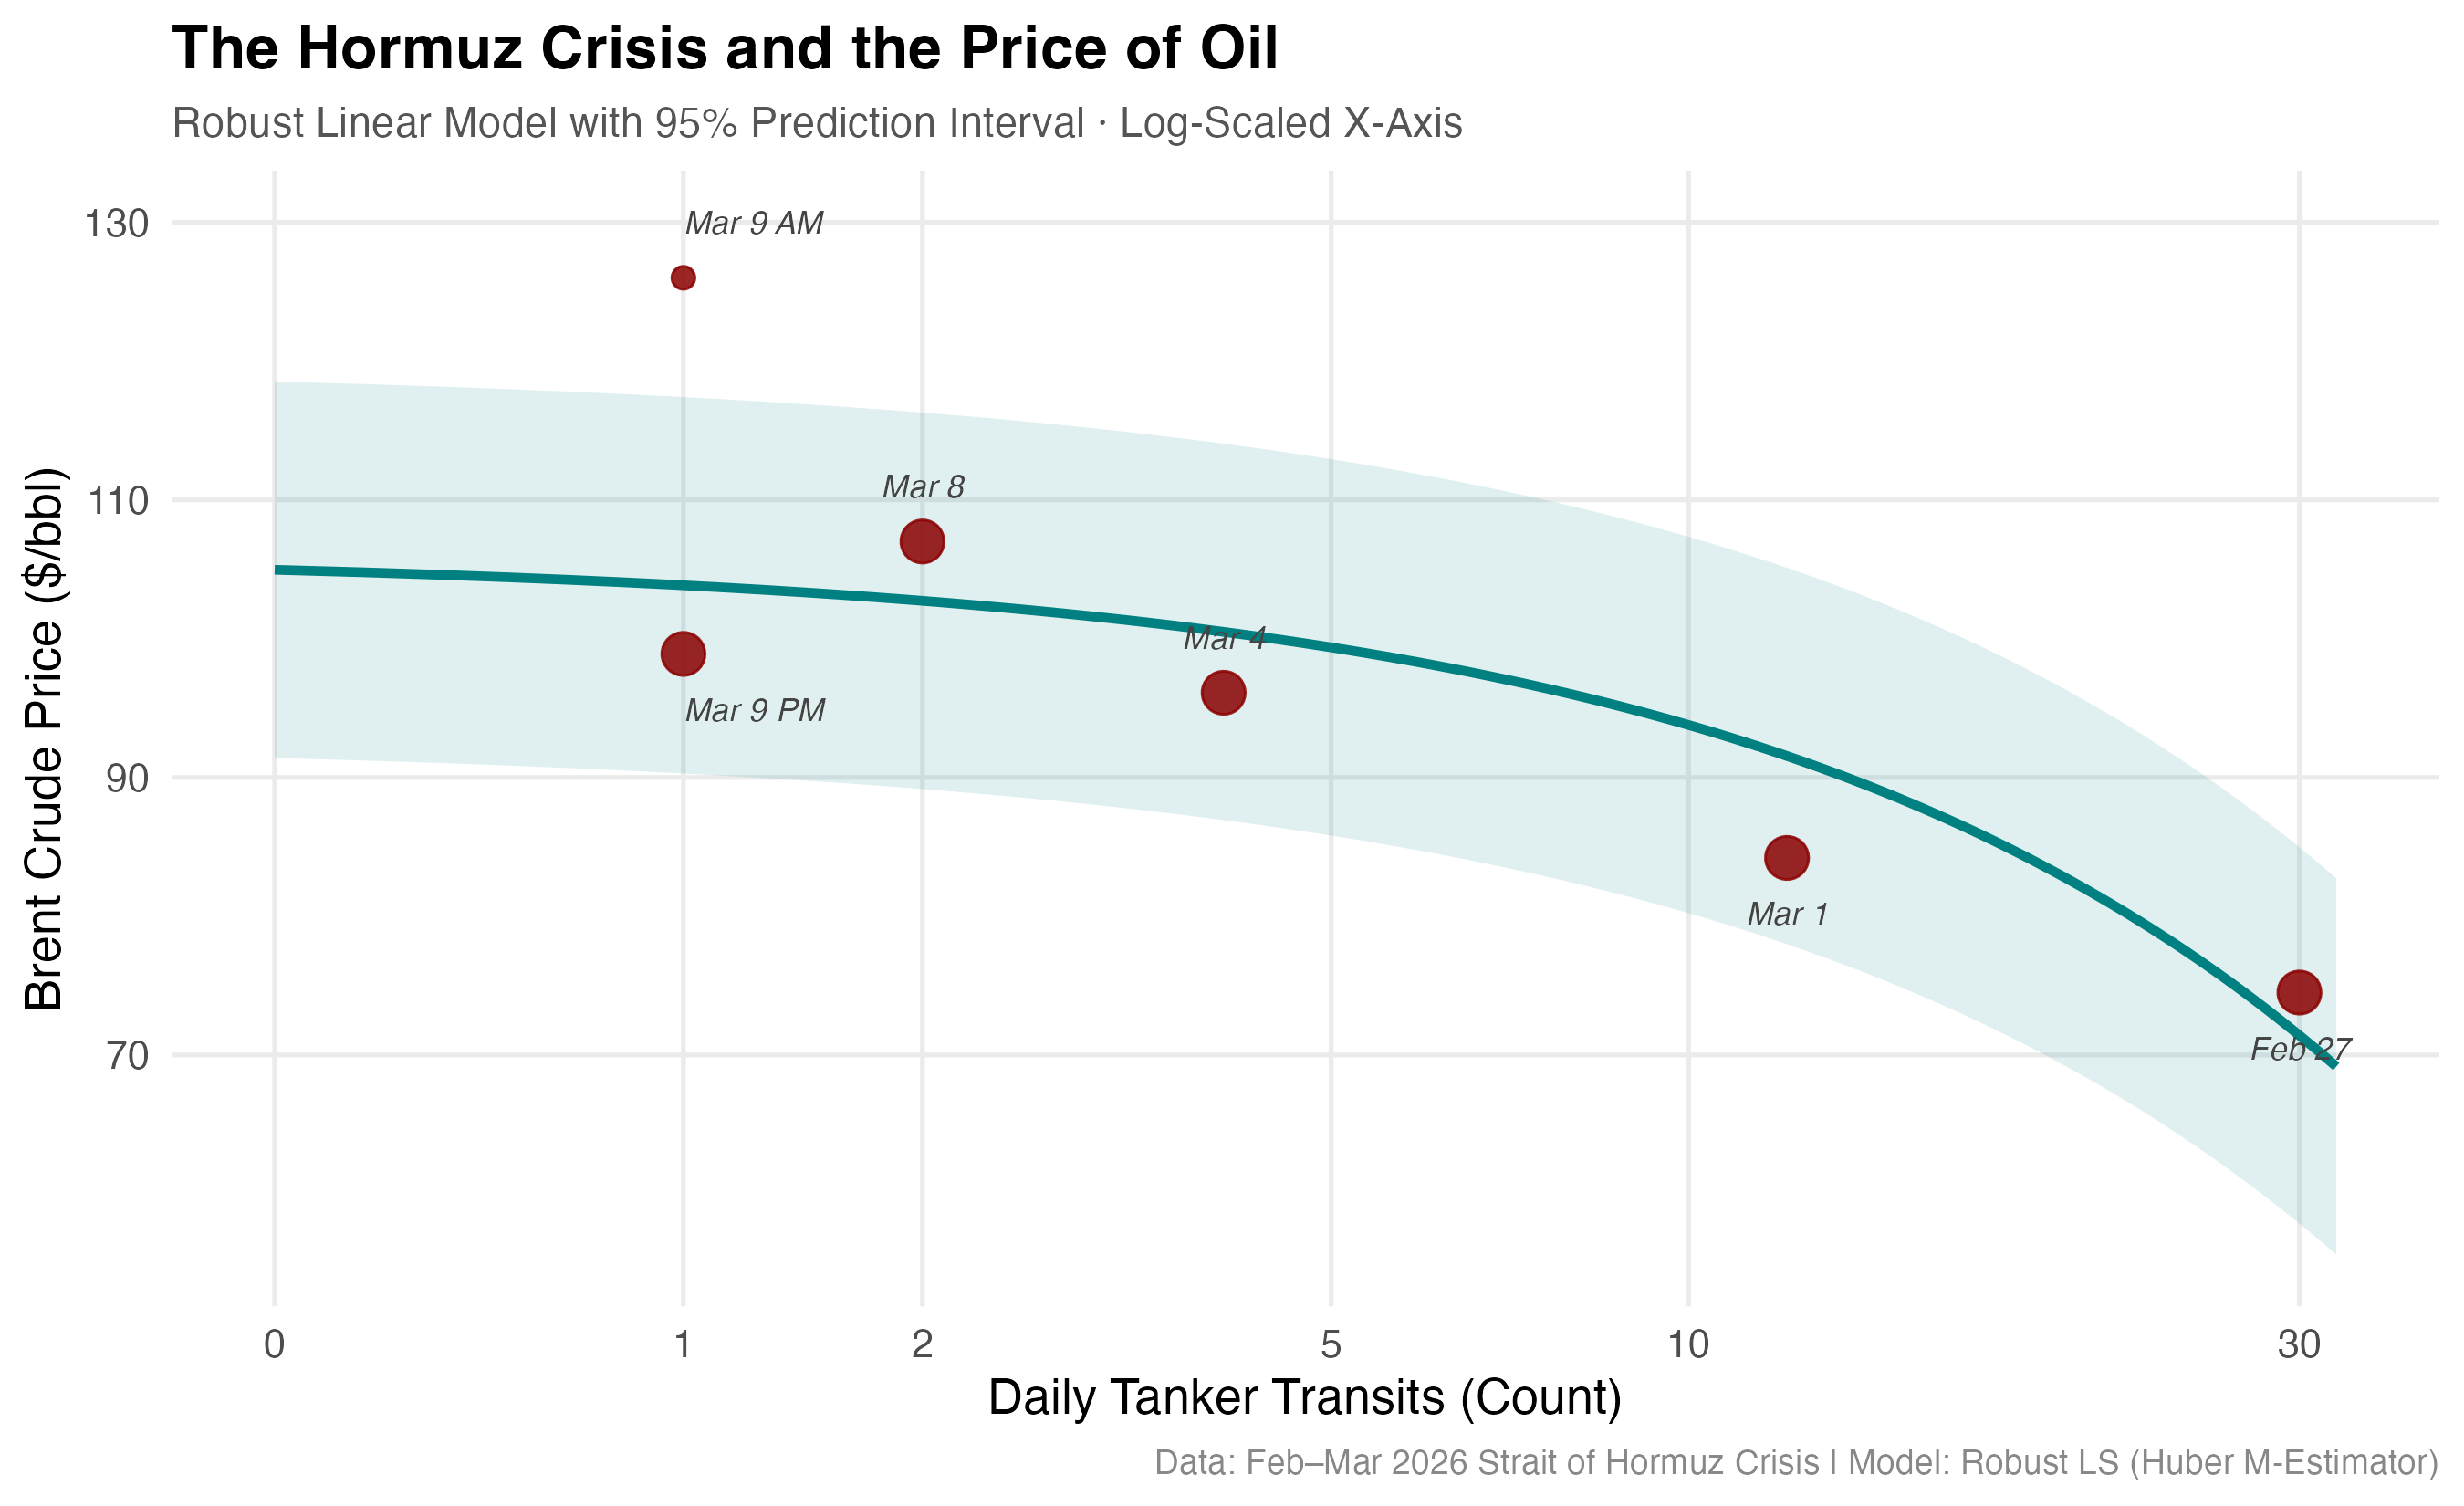
Point size in the chart reflects each observation's Huber weight — how much influence the model assigns to it. Larger points sit closer to the trend; smaller points were downweighted as outliers.
Why $126 Was Panic, Not Price Discovery
The Huber M-estimator assigns the March 9th AM spike a weight of just 0.42 (compared to 1.0 for every other observation). In practical terms, the algorithm is telling us that this $126 reading was driven more by a short-lived liquidity vacuum than by a fundamental supply shift. Thin order books in the early session amplified the move far beyond what physical scarcity alone would justify.
The Cooling Effect of Marginal Supply
Because the model's x-axis is log-scaled, equal visual distances correspond to multiplicative changes in throughput. That means moving from 1 to 2 daily transits (a doubling) has a disproportionately large cooling effect on prices compared to an equivalent absolute increase at higher volumes. A single additional tanker — like the Shenlong transit this morning — can shift the market's crisis calculus more than an extra dozen tankers would under normal conditions.