 RevenueMix
Quantify what actually drives revenue — ads, headcount, R&D, SG&A, and beyond.
Paste your revenue data alongside any spend drivers — advertising, sales headcount, R&D, SG&A, or any other factors. Get statistically grounded revenue impact estimates in under 5 minutes.
100% private — your data never leaves your browser. All analysis runs locally on your device.
1. Import Your Data
Paste from a spreadsheet or upload a CSV. Include column headers in the first row.
2. Assign Variable Roles
Map each column to its role. We've auto-suggested based on column names.
Fitting model...
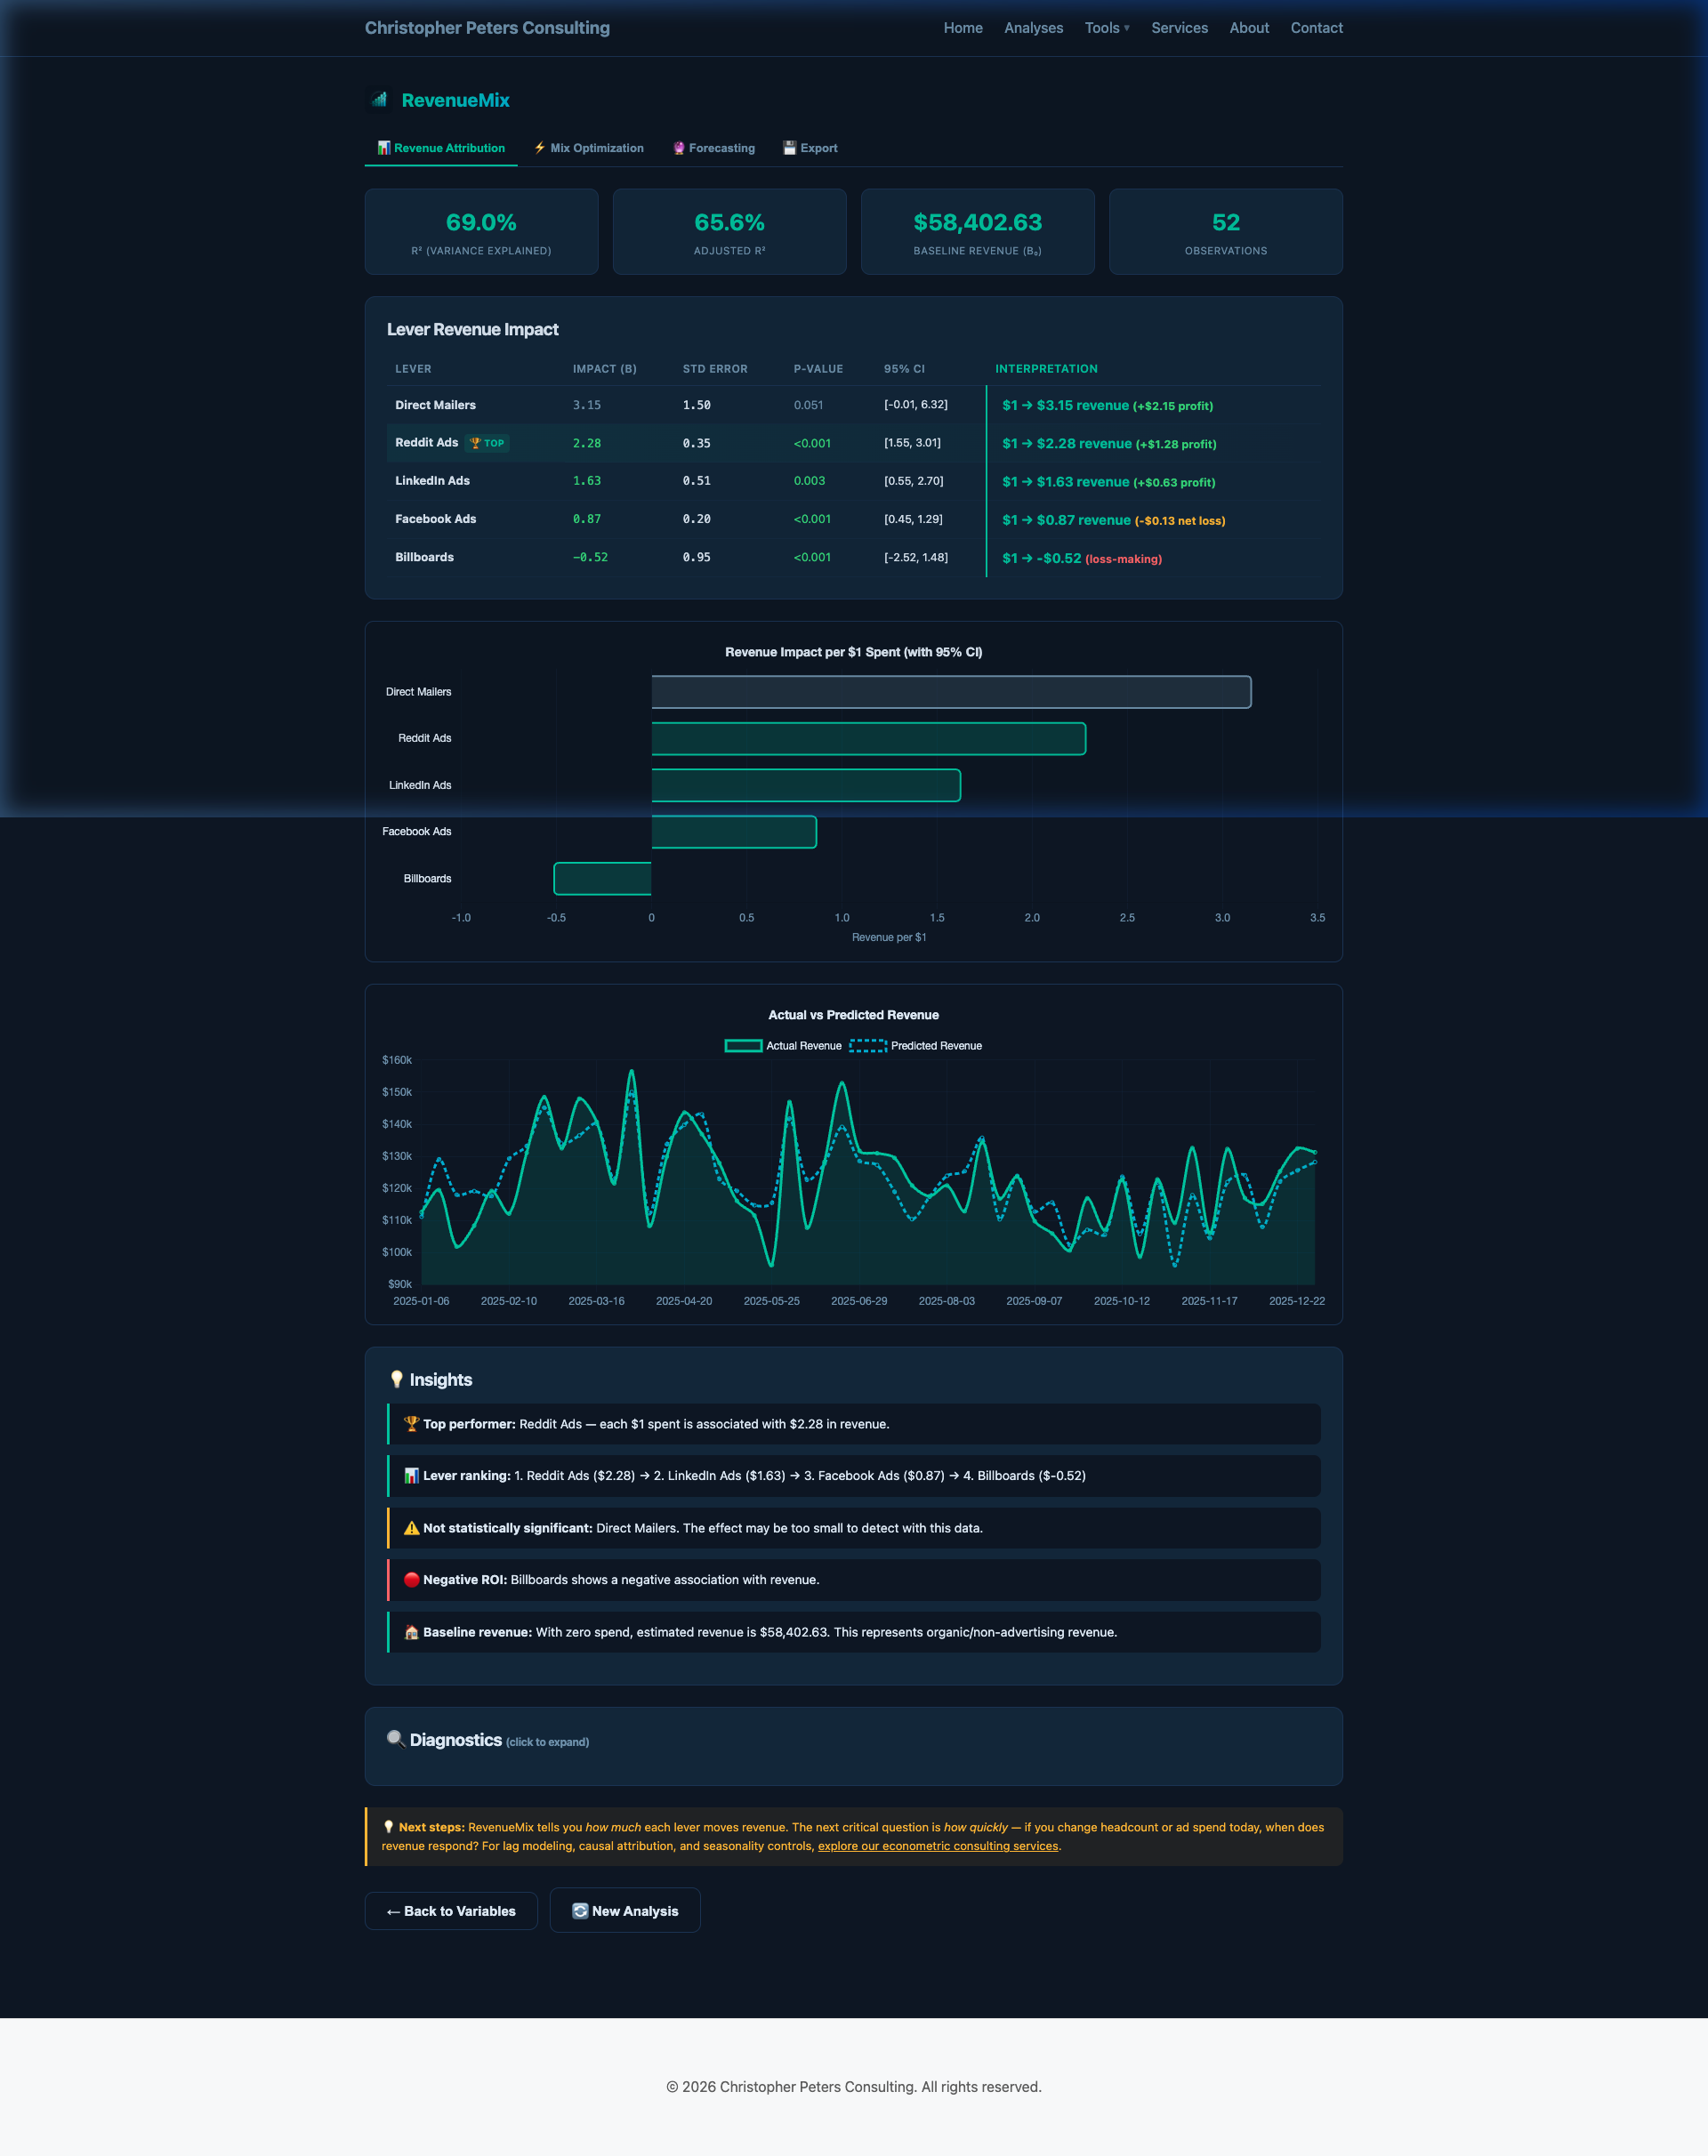
Lever Revenue Impact
💡 Insights
🔍 Diagnostics (click to expand)
💡 Next steps: RevenueMix tells you how much each lever moves revenue. The next critical question is how quickly — if you change headcount or ad spend today, when does revenue respond? For lag modeling, causal attribution, and seasonality controls, explore our econometric consulting services.
Lever Ranking by Revenue Impact
Budget Allocator
Scenario Builder
Adjust spend levels to forecast revenue.
-
Baseline Revenue
-
Scenario Revenue
-
Delta
Export Results
Download the coefficient table as CSV.