Vistra Corp. VST
Revenue Intelligence Report • 37 quarters of SEC filing data • Updated 2026-03-15
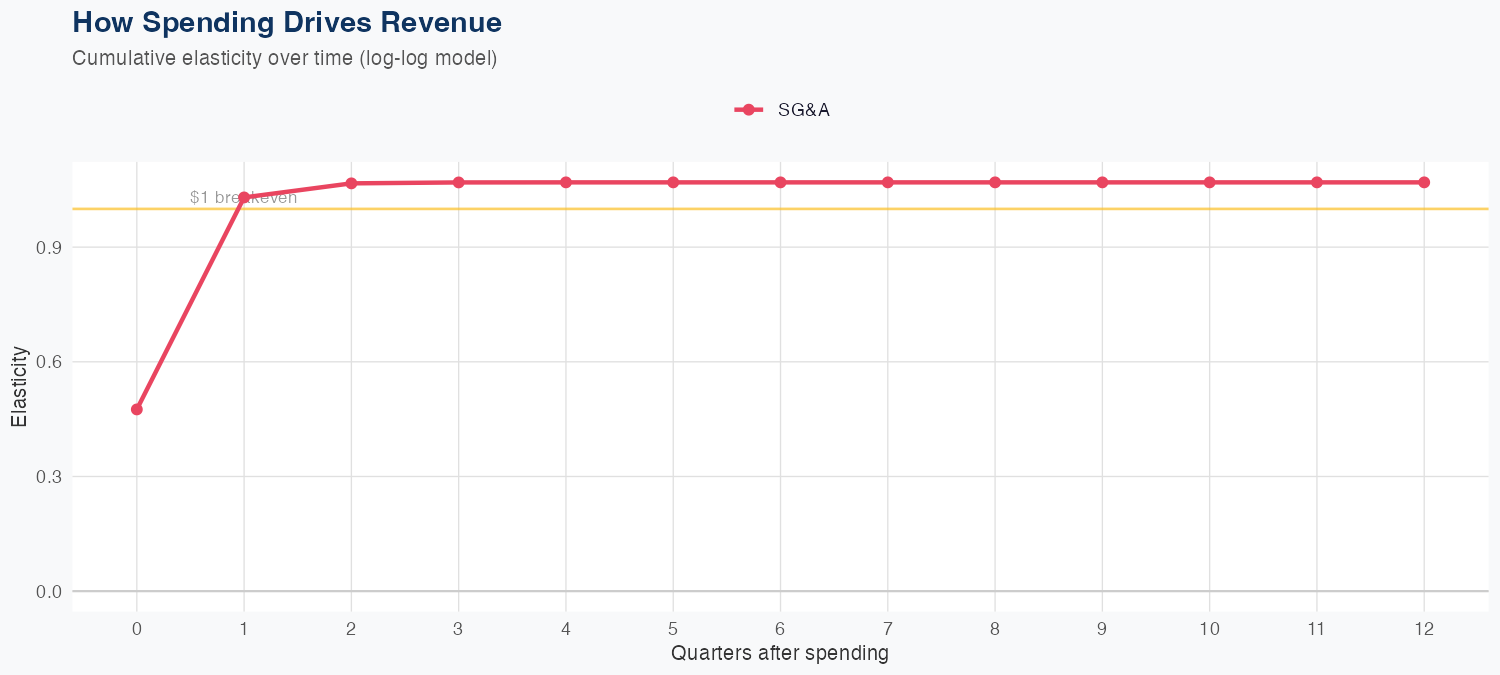
In a log-log model, SG&A spending shows an elasticity of about 1.11 on revenue, implying a 1% increase in SG&A is associated with roughly a 1.11% rise in revenue. However, model accuracy is limited: the holdout forecast missed by 13% (predicted $5.2B vs actual $4.6B) and the overall MAPE is 20.9%, signaling meaningful uncertainty in forecasting ROI from SG&A spending. The latest quarterly revenue is 4.584B, while the FY outlook calls for about 23B, up 28.1% year over year, indicating a strong growth trajectory. Investors should weigh the positive revenue responsiveness to SG&A spend against the model's accuracy gaps and the ambitious full-year forecast when evaluating the sustainability and ROI of the company's spending and growth outlook.
Investment Thesis
At 20.9% MAPE, the model captures Vistra Corp.'s broad revenue trajectory, though quarterly variability suggests sensitivity to external factors. Sales & marketing spend shows a 1.11x elasticity, suggesting effective go-to-market execution.
Revenue Forecast
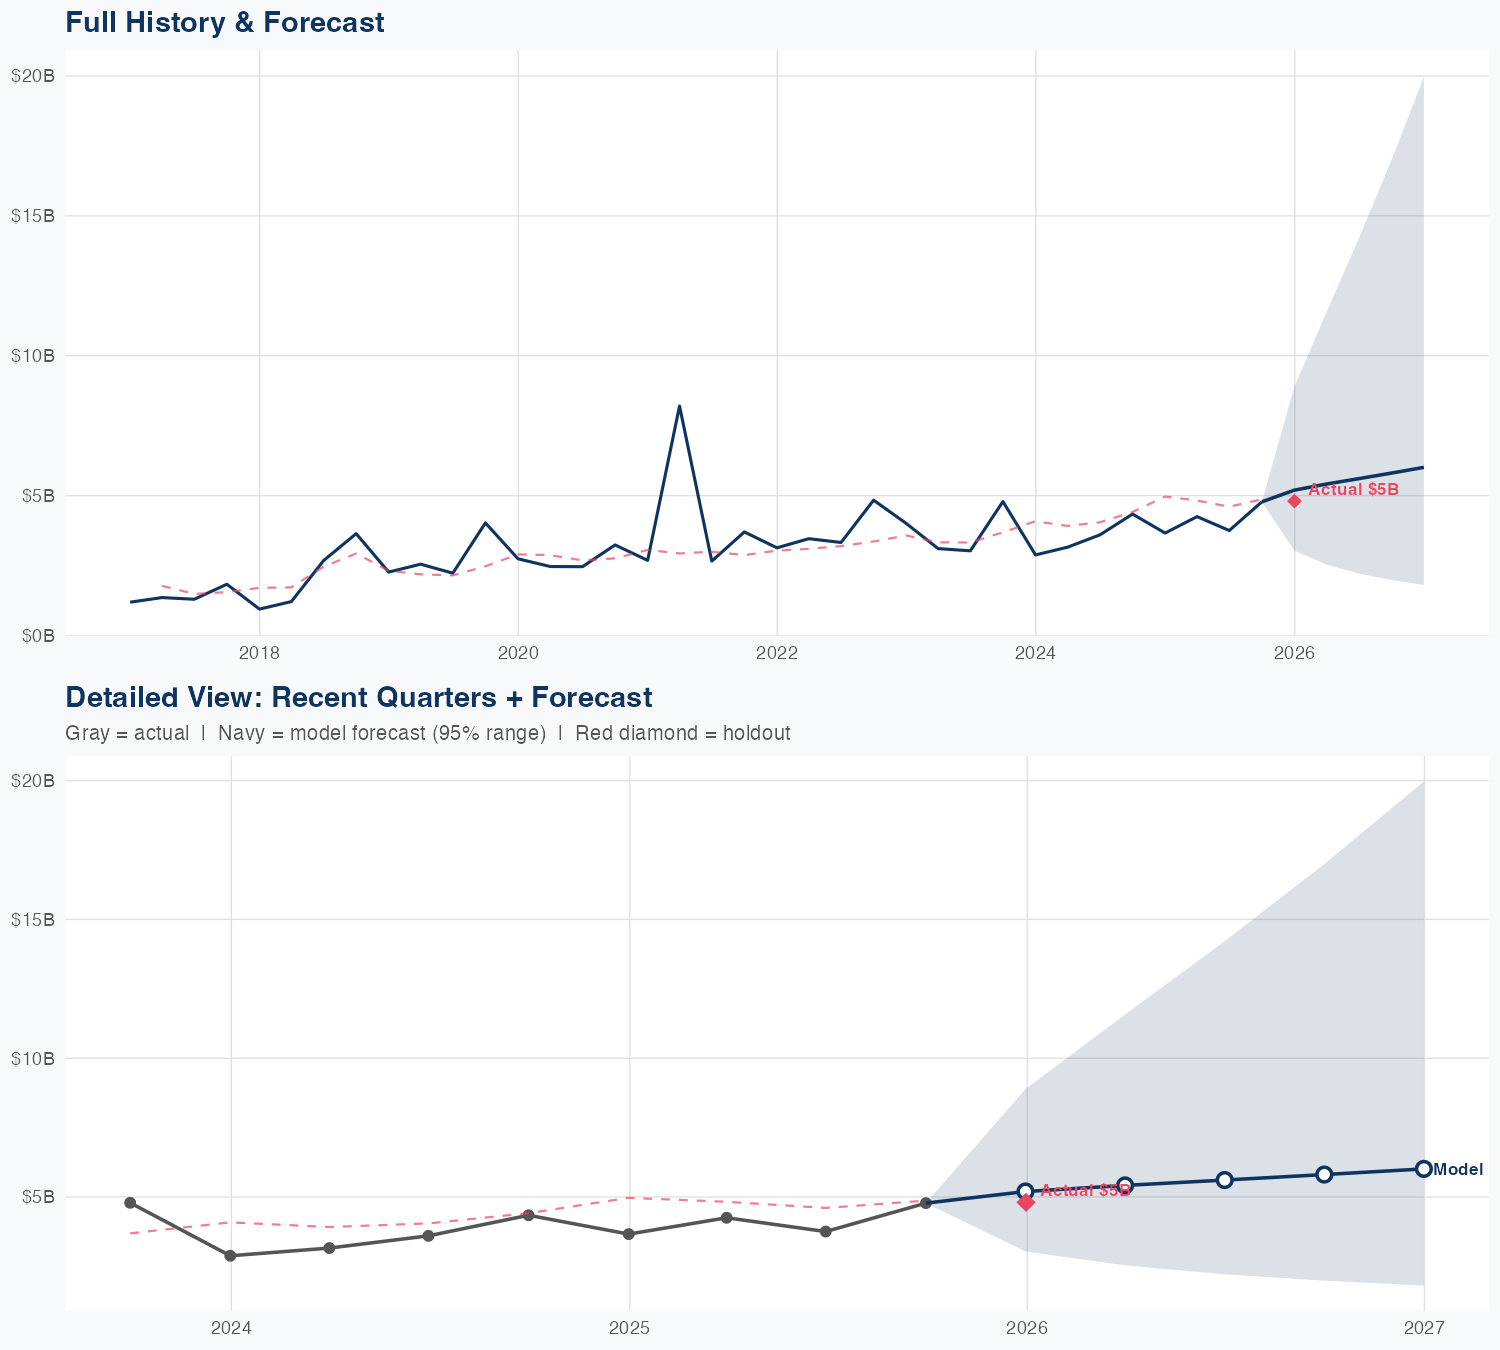
Quarterly Detail
| Quarter | Model Forecast | Actual | 95% Range | YoY Growth | Status |
|---|---|---|---|---|---|
| Q4 2025 | $5.2B | $4.6B | $3.0B – $8.8B | +28.3% | ✓ In range |
| Q2 2026 | $5.4B | $2.5B – $11B | +36.7% | ||
| Q3 2026 | $5.6B | $2.2B – $14B | +31.2% | ||
| Q4 2026 | $5.8B | $2.0B – $17B | +16.2% | ||
| Q4 2026 | $6.0B | $1.8B – $20B | +30.6% |
Seasonal Factors
| Fiscal Quarter | Seasonal Factor | vs Trend | Interpretation | Obs. |
|---|---|---|---|---|
| FQ1 (Sep–Nov) | 1.2768 | +27.7% | +27.7% above trend | 9 |
| FQ2 (Dec–Feb) | 0.8878 | -11.2% | -11.2% below trend | 9 |
| FQ3 (Mar–May) | 1.0376 | +3.8% | +3.8% above trend | 9 |
| FQ4 (Jun–Aug) | 0.9425 | -5.8% | -5.8% below trend | 9 |
How Spending Drives Revenue
Want this analysis for your portfolio?
I build custom revenue intelligence reports for investors and companies using SEC filing data, econometric modeling, and AI-powered insights.
Get in Touch