Waste Management Inc WM
Revenue Intelligence Report • 70 quarters of SEC filing data • Updated 2026-03-15
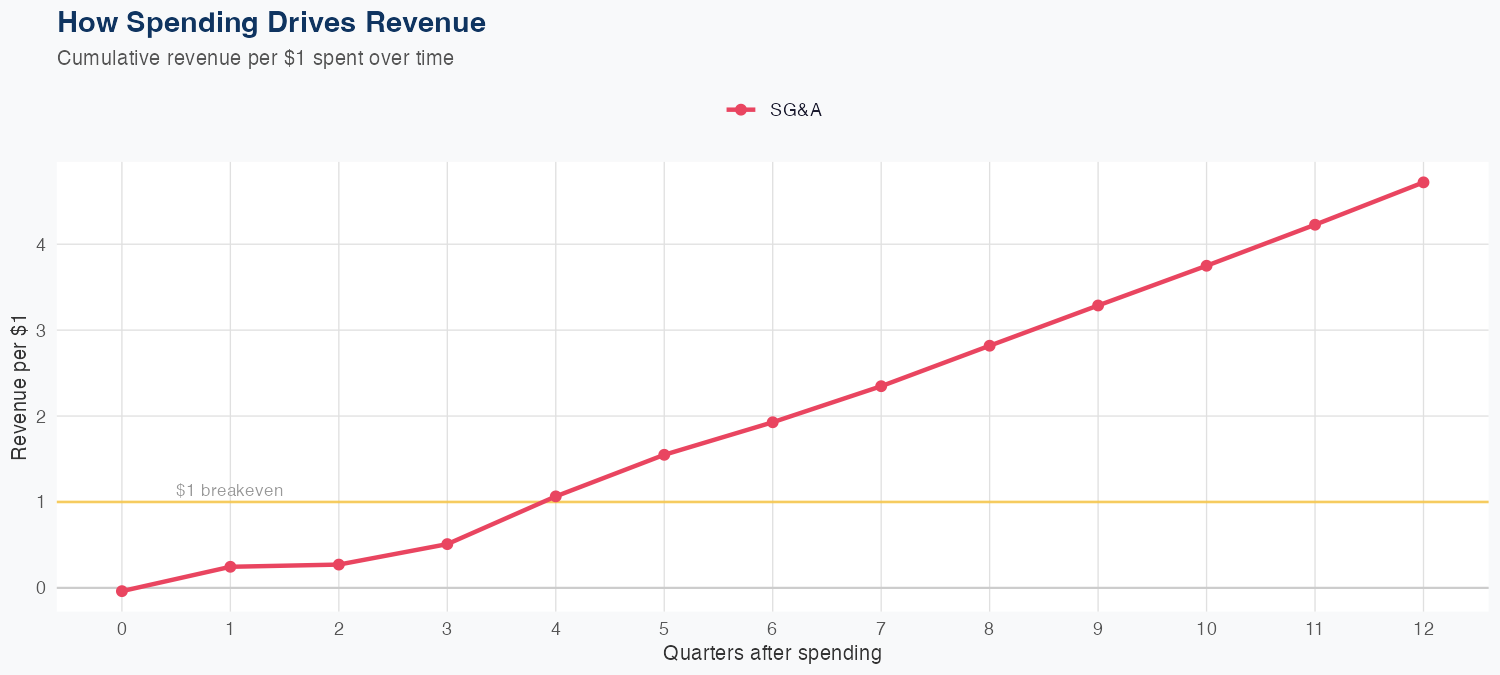
SG&A spending appears to be the primary revenue driver, with each $1 of SG&A generating $4.72 of long-run revenue, signaling strong operating expense efficiency. The forecasting model is linear, trained on 70 quarters of data, and shows a 3.0% MAPE with a holdout test error of -2.4% (predicted $6.5B vs actual $6.3B), indicating credible forecast performance. The latest quarterly revenue is $6.313B, and the FY forecast is $29B, up 13.1% year over year, implying solid growth momentum. With efficient SG&A-driven upside and a double-digit growth outlook, the stock presents a favorable revenue trajectory, though investors should monitor the sustainability of SG&A-driven gains amid changing market conditions.
Investment Thesis
Our ARDL model tracks Waste Management Inc's revenue with exceptional precision (3.0% MAPE), indicating highly predictable cash flows. Each $1 of SG&A spending generates $4.72 in revenue, reflecting strong commercial efficiency.
Revenue Forecast
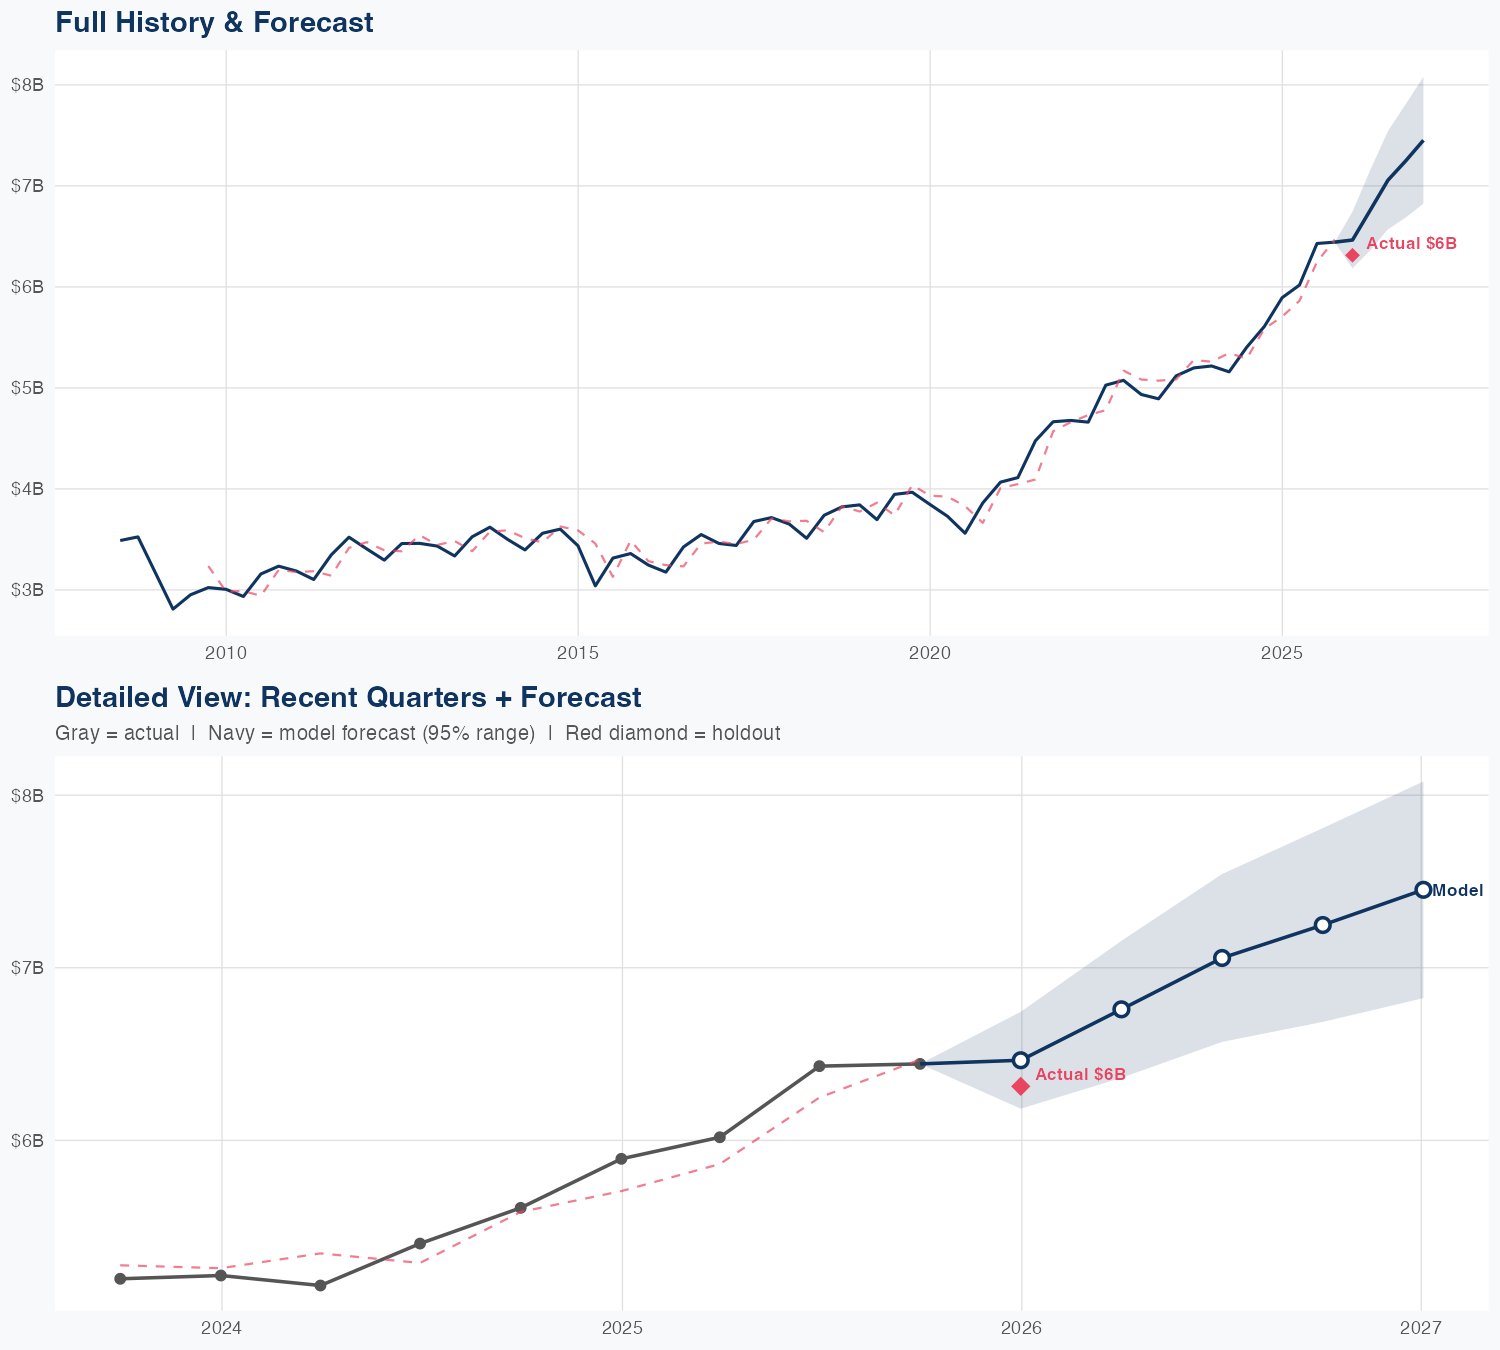
Quarterly Detail
| Quarter | Model Forecast | Actual | 95% Range | YoY Growth | Status |
|---|---|---|---|---|---|
| Q4 2025 | $6.5B | $6.3B | $6.2B – $6.7B | +9.7% | ✓ In range |
| Q2 2026 | $6.8B | $6.4B – $7.2B | +12.3% | ||
| Q3 2026 | $7.1B | $6.6B – $7.5B | +9.7% | ||
| Q4 2026 | $7.2B | $6.7B – $7.8B | +12.5% | ||
| Q1 2027 | $7.5B | $6.8B – $8.1B | +18.0% |
Seasonal Factors
| Fiscal Quarter | Seasonal Factor | vs Trend | Interpretation | Obs. |
|---|---|---|---|---|
| FQ1 (Sep–Nov) | 0.9982 | -0.2% | In line with trend | 17 |
| FQ2 (Dec–Feb) | 0.9927 | -0.7% | In line with trend | 17 |
| FQ3 (Mar–May) | 0.9712 | -2.9% | In line with trend | 16 |
| FQ4 (Jun–Aug) | 1.0516 | +5.2% | +5.2% above trend | 16 |
How Spending Drives Revenue
Want this analysis for your portfolio?
I build custom revenue intelligence reports for investors and companies using SEC filing data, econometric modeling, and AI-powered insights.
Get in Touch