Align Technology, inc. ALGN
Revenue Intelligence Report • 22 quarters of SEC filing data • Updated 2026-03-15
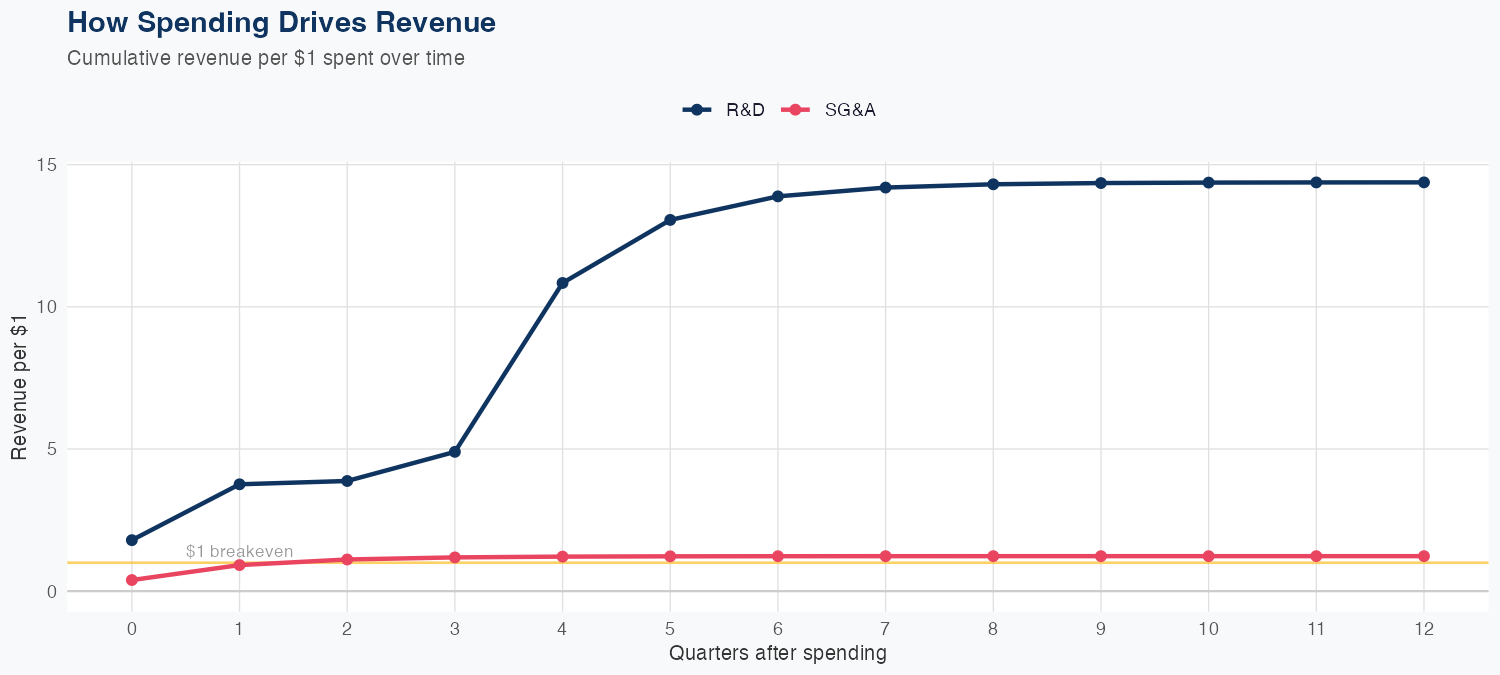
Revenue is driven primarily by R&D-led product development, with SG&A contributing more modestly to the top line. The model implies a strong ROI on spending: roughly $14.38 of long-run revenue per $1 of R&D, versus about $1.23 of revenue per $1 of SG&A, underscoring R&D as the key growth engine. The model shows solid predictive accuracy, with 2.4% MAPE and a holdout error of 1.1% (latest quarter revenue of $199M vs predicted $196M). For the year, revenue is forecast at $810M, up about 6.4% year over year, indicating a steady growth trajectory supported by efficient spending and ongoing product adoption.
Investment Thesis
Our ARDL model tracks Align Technology, inc.'s revenue with exceptional precision (2.4% MAPE), indicating highly predictable cash flows. Every $1 of R&D investment is associated with $14.38 of revenue, indicating efficient capital deployment in innovation. Each $1 of SG&A spending generates $1.23 in revenue, reflecting strong commercial efficiency.
Revenue Forecast
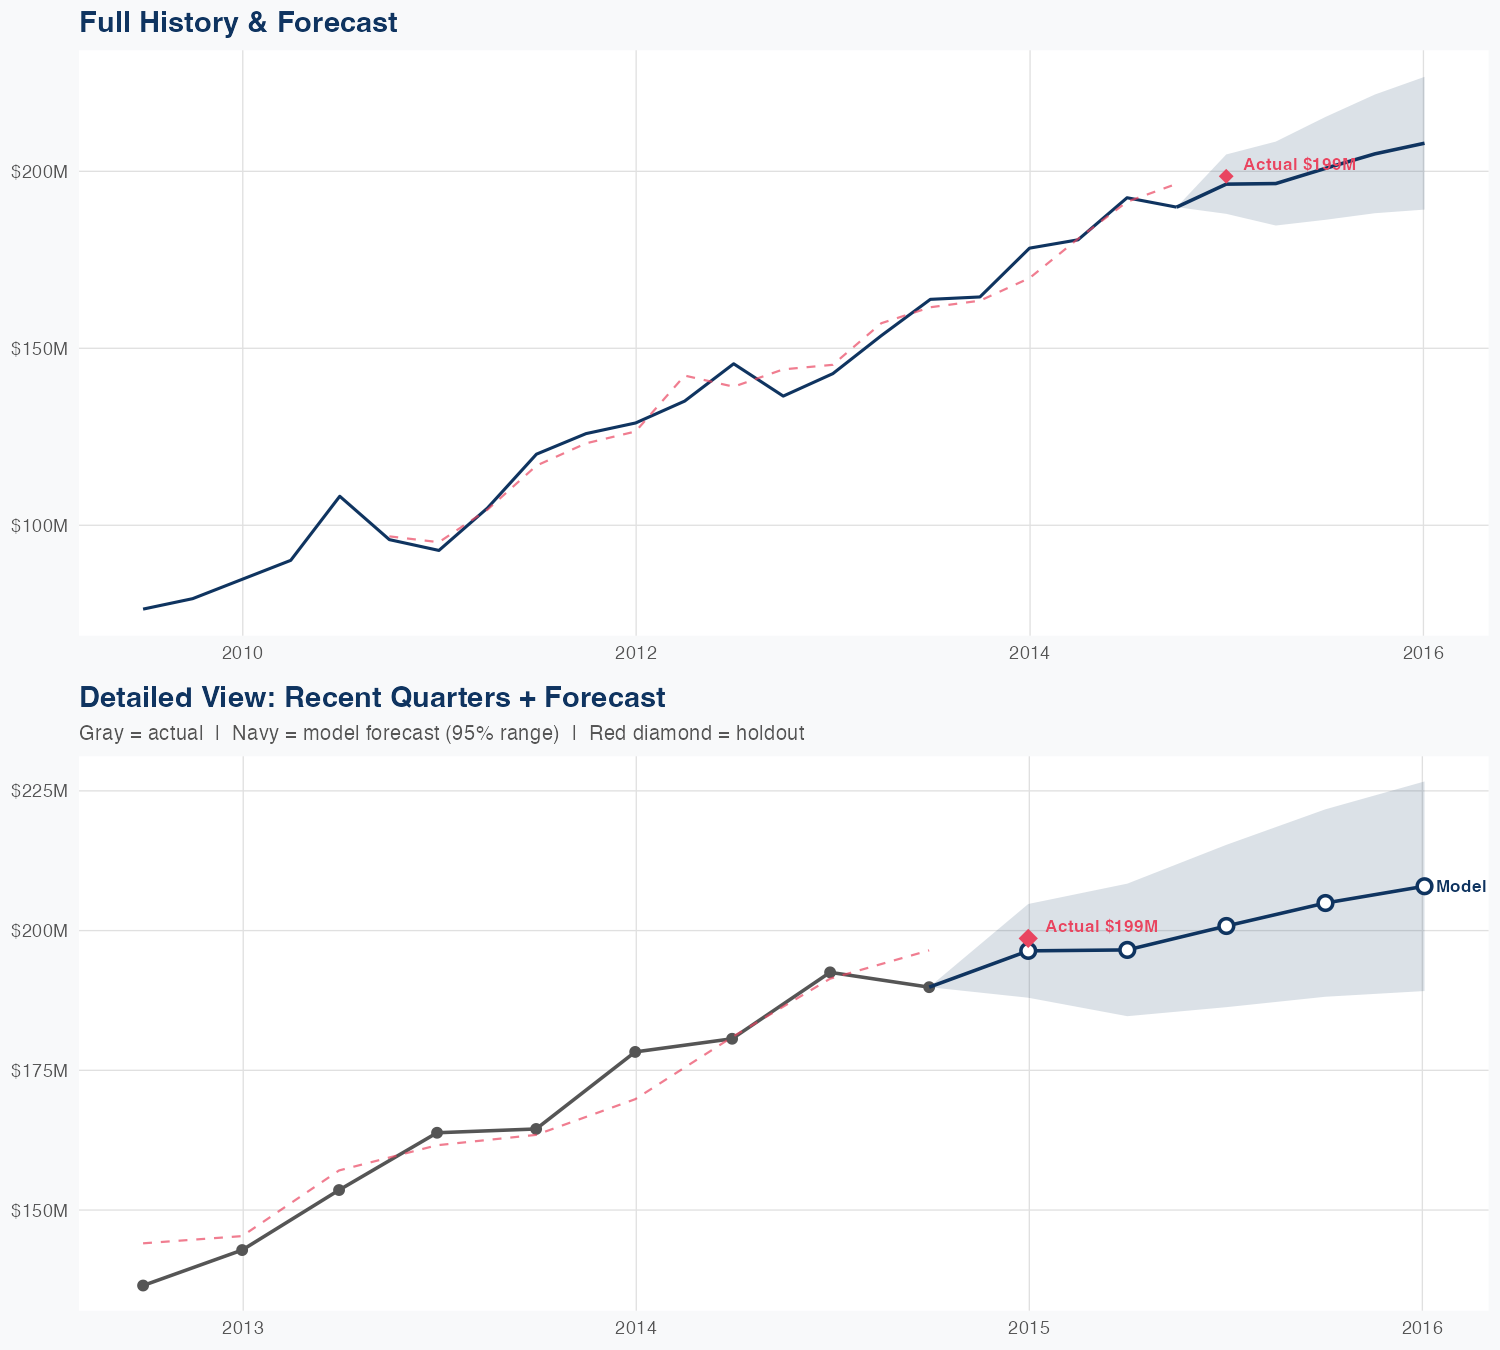
Quarterly Detail
| Quarter | Model Forecast | Actual | 95% Range | YoY Growth | Status |
|---|---|---|---|---|---|
| Q4 2014 | $196M | $199M | $188M – $205M | +10.1% | ✓ In range |
| Q2 2015 | $197M | $185M – $208M | +8.8% | ||
| Q3 2015 | $201M | $186M – $215M | +4.3% | ||
| Q4 2015 | $205M | $188M – $222M | +7.9% | ||
| Q1 2016 | $208M | $189M – $227M | +4.7% |
Seasonal Factors
| Fiscal Quarter | Seasonal Factor | vs Trend | Interpretation | Obs. |
|---|---|---|---|---|
| FQ1 (Sep–Nov) | 0.9905 | -1.0% | In line with trend | 5 |
| FQ2 (Dec–Feb) | 1.0138 | +1.4% | In line with trend | 5 |
| FQ3 (Mar–May) | 0.9984 | -0.2% | In line with trend | 4 |
| FQ4 (Jun–Aug) | 1.0276 | +2.8% | In line with trend | 4 |
How Spending Drives Revenue
Want this analysis for your portfolio?
I build custom revenue intelligence reports for investors and companies using SEC filing data, econometric modeling, and AI-powered insights.
Get in Touch