Amgen Inc AMGN
Revenue Intelligence Report • 70 quarters of SEC filing data • Updated 2026-03-15
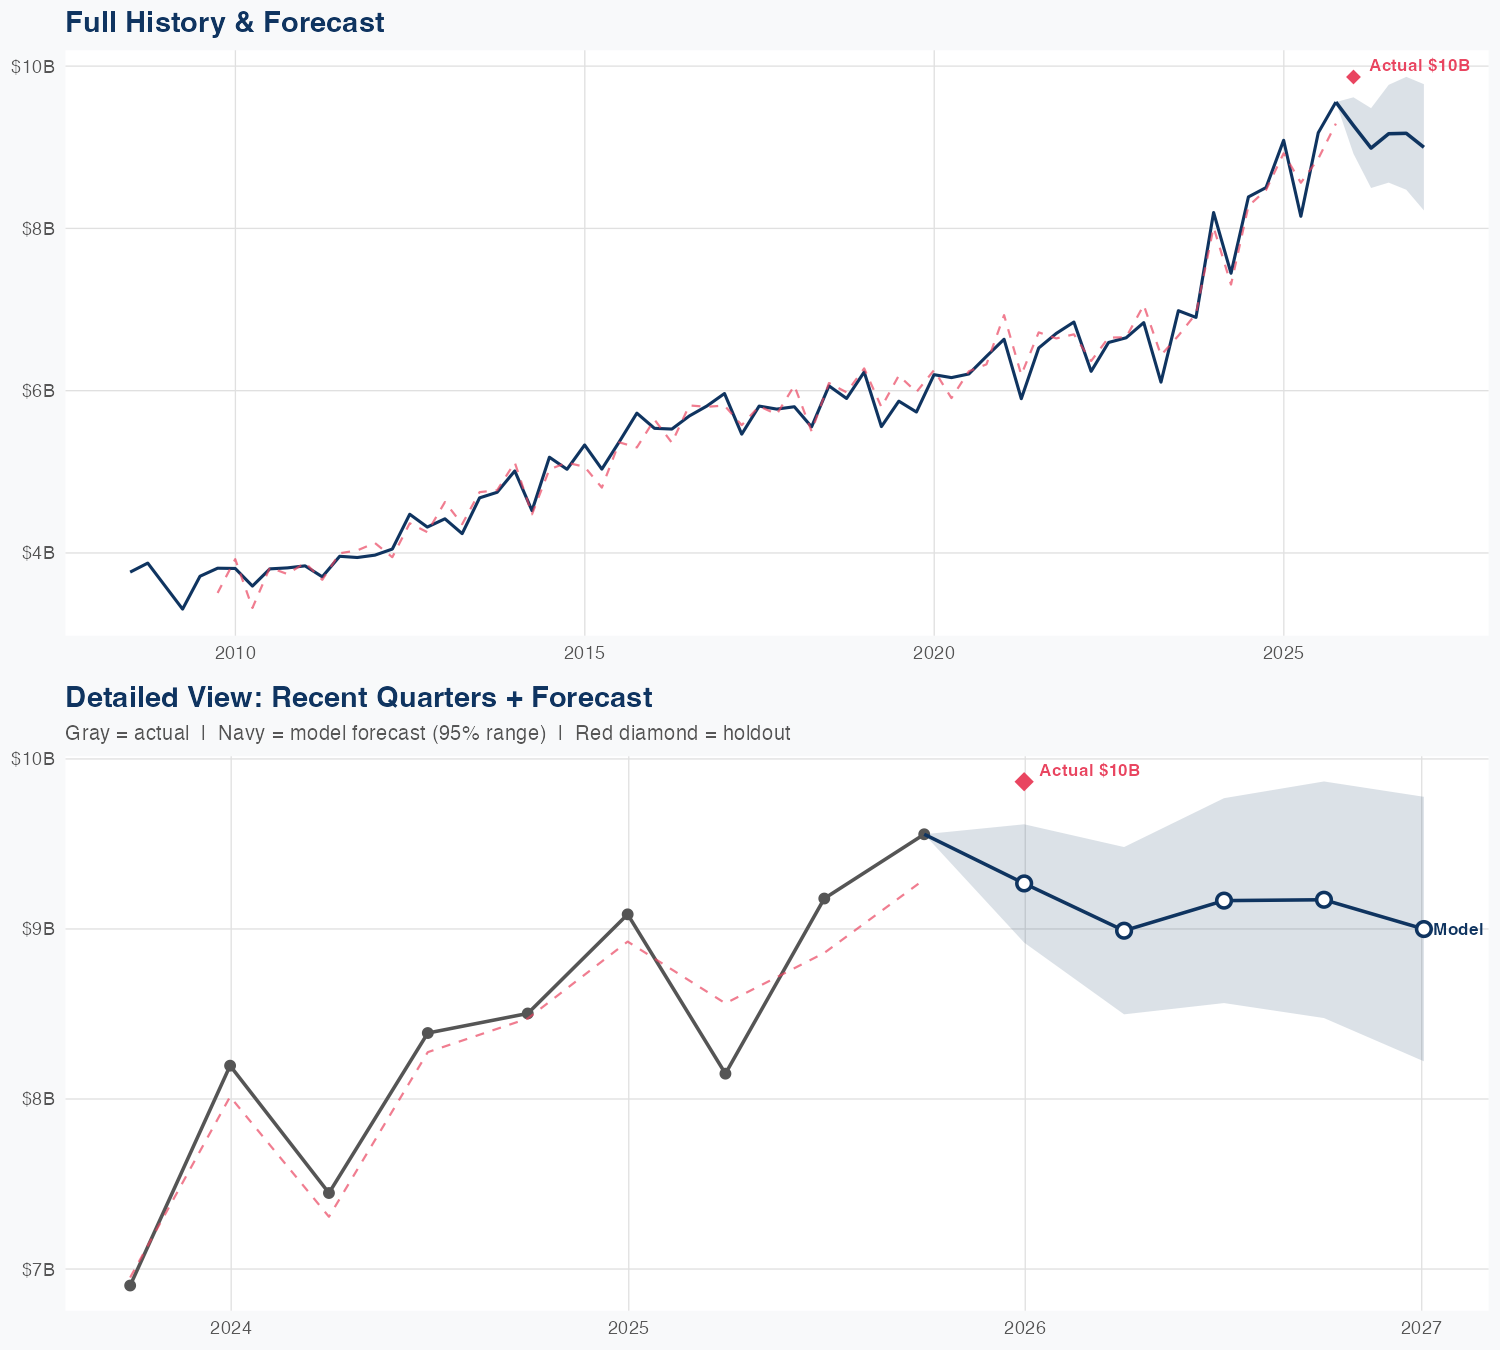
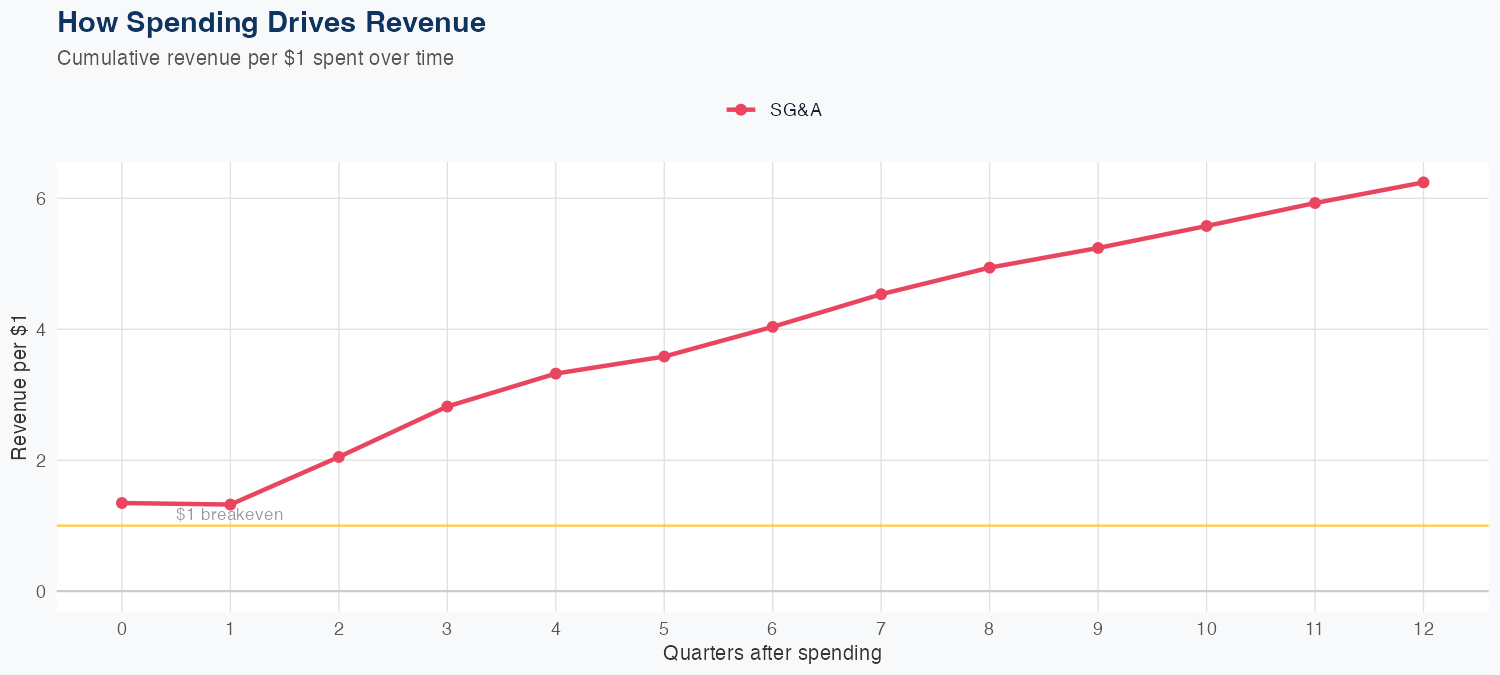
Latest quarterly revenue stood at $9.866 billion. For Amgen Inc (AMGN), the revenue model ties growth to SG&A spending, with an implied ROI of $6.24 of long-run revenue per $1 of SG&A. The model is linear (MAPE 2.5%), and a holdout test predicted $9.30B versus actual $9.90B (6.1% error), indicating modest out-of-sample miss. The FY revenue forecast is about $36B, down 1.2% year over year, signaling modest top-line pressure while SG&A efficiency remains a key driver.
Investment Thesis
Our ARDL model tracks Amgen Inc's revenue with exceptional precision (2.5% MAPE), indicating highly predictable cash flows. Each $1 of SG&A spending generates $6.24 in revenue, reflecting strong commercial efficiency.
Revenue Forecast
Quarterly Detail
| Quarter | Model Forecast | Actual | 95% Range | YoY Growth | Status |
|---|---|---|---|---|---|
| Q4 2025 | $9.3B | $9.9B | $8.9B – $9.6B | +2.0% | ✗ Outside range |
| Q2 2026 | $9.0B | $8.5B – $9.5B | +10.3% | ||
| Q3 2026 | $9.2B | $8.6B – $9.8B | -0.1% | ||
| Q4 2026 | $9.2B | $8.5B – $9.9B | -4.0% | ||
| Q1 2027 | $9.0B | $8.2B – $9.8B | -8.8% |
Seasonal Factors
| Fiscal Quarter | Seasonal Factor | vs Trend | Interpretation | Obs. |
|---|---|---|---|---|
| FQ1 (Sep–Nov) | 1.0035 | +0.4% | In line with trend | 17 |
| FQ2 (Dec–Feb) | 0.9901 | -1.0% | In line with trend | 17 |
| FQ3 (Mar–May) | 1.01 | +1.0% | In line with trend | 16 |
| FQ4 (Jun–Aug) | 0.9958 | -0.4% | In line with trend | 16 |
How Spending Drives Revenue
Want this analysis for your portfolio?
I build custom revenue intelligence reports for investors and companies using SEC filing data, econometric modeling, and AI-powered insights.
Get in Touch