Quest Diagnostics Incorporated DGX
Revenue Intelligence Report • 70 quarters of SEC filing data • Updated 2026-03-15
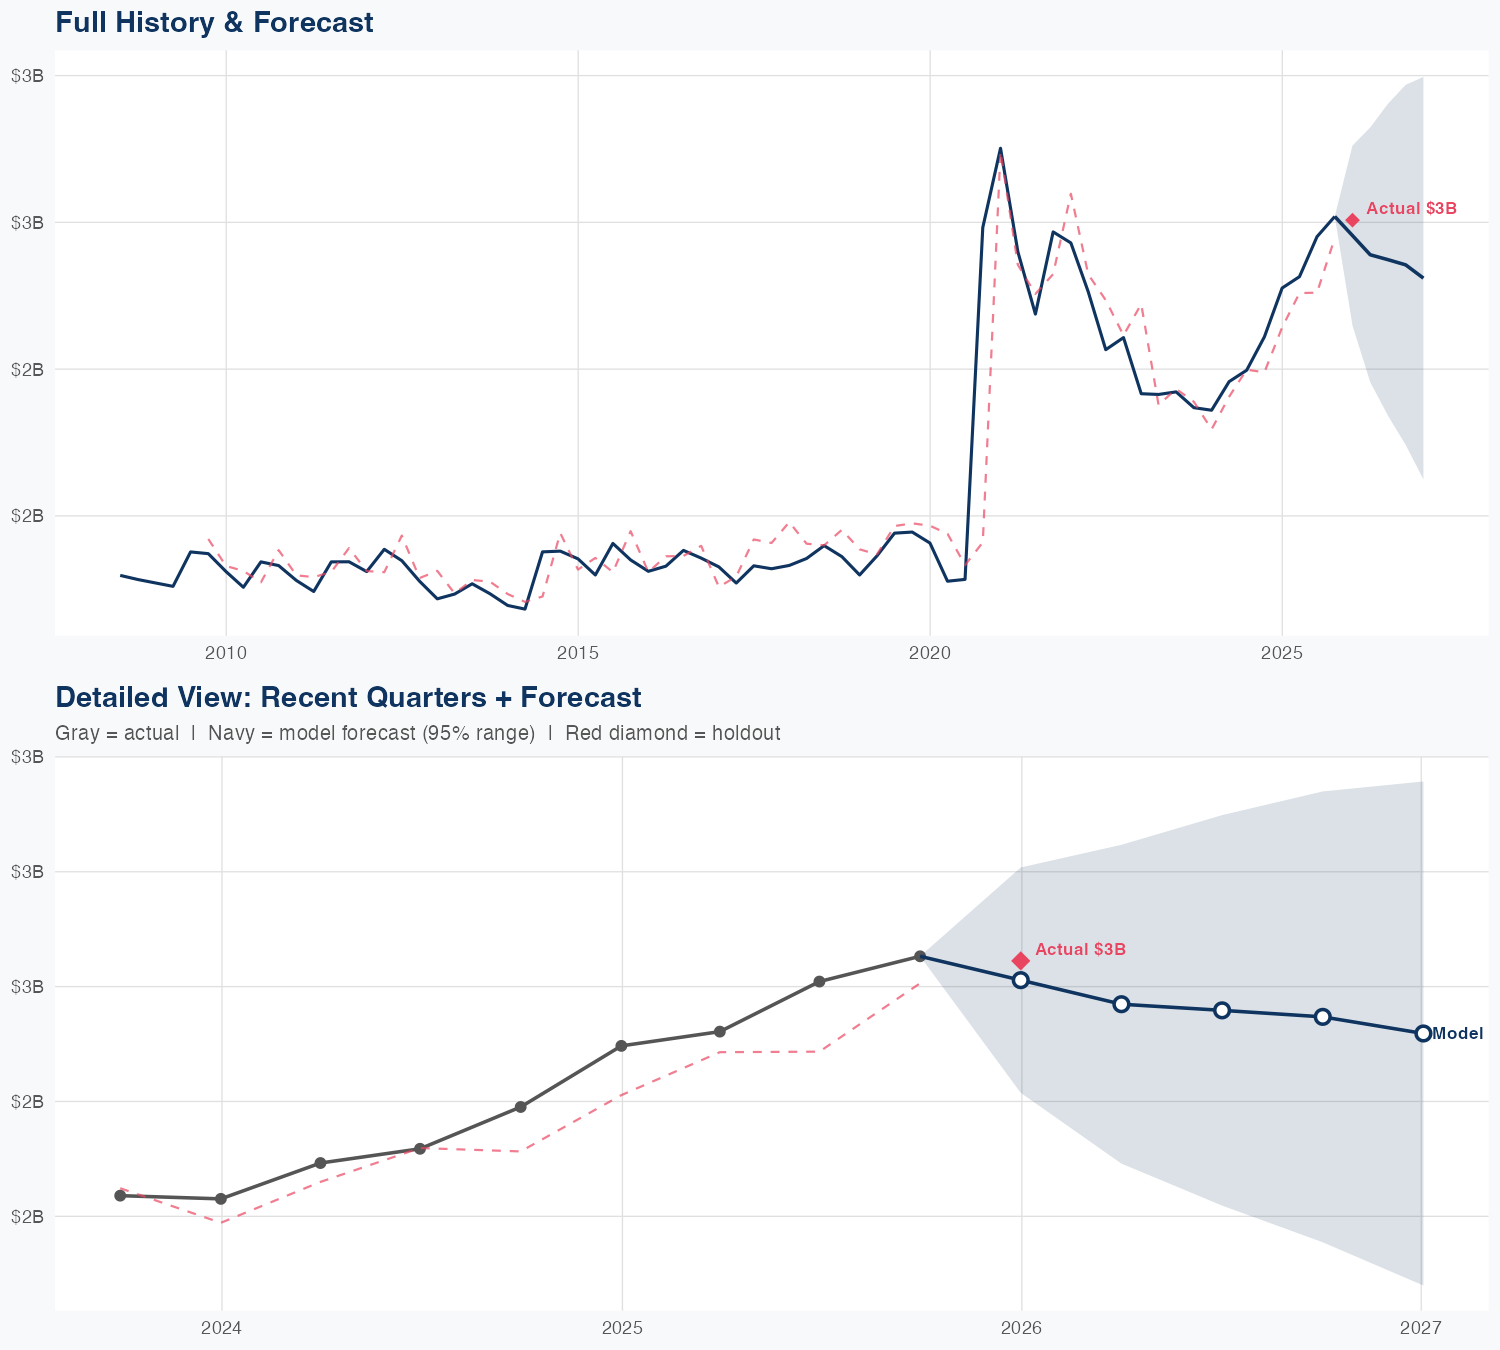
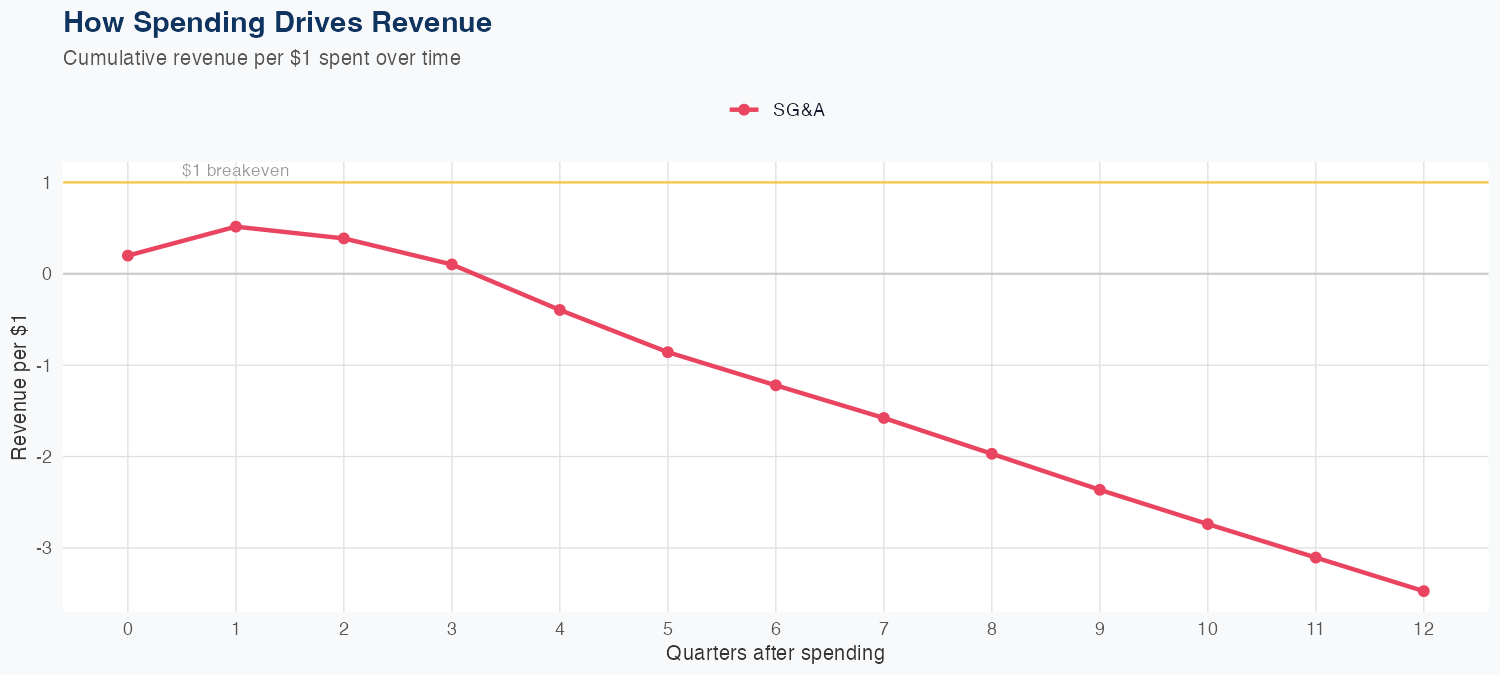
Revenue growth is driven by SG&A spending, which the log-log model shows with a positive elasticity of 0.26% in revenue for every 1% increase in SG&A (R&D data not available). Recent quarterly revenue was about $2.806 billion, and holdout testing predicted $2.8B versus actual $2.8B (0.3% error) with a model MAPE of 3.2%, underscoring forecast reliability in the near term. The ROI on SG&A investments appears modest, as a 1% SG&A increase yields only about 0.26% additional revenue, making margin gains from efficiency and targeted spending critical to creating value. The FY revenue forecast is about $11B, a +0.3% YoY change, signaling a stable, low-growth outlook where disciplined SG&A management and efficiency improvements will drive profitability alongside the steady top line.
Investment Thesis
The econometric model achieves strong accuracy (3.2% MAPE), suggesting Quest Diagnostics Incorporated's revenue trajectory is well-characterized by its spending patterns. Sales & marketing spend shows a 0.26x elasticity, suggesting effective go-to-market execution.
Revenue Forecast
Quarterly Detail
| Quarter | Model Forecast | Actual | 95% Range | YoY Growth | Status |
|---|---|---|---|---|---|
| Q4 2025 | $2.8B | $2.8B | $2.5B – $3.1B | +6.7% | ✓ In range |
| Q2 2026 | $2.8B | $2.4B – $3.3B | +4.9% | ||
| Q3 2026 | $2.8B | $2.3B – $3.4B | +0.3% | ||
| Q4 2026 | $2.8B | $2.2B – $3.5B | -1.9% | ||
| Q1 2027 | $2.8B | $2.1B – $3.6B | -1.8% |
Seasonal Factors
| Fiscal Quarter | Seasonal Factor | vs Trend | Interpretation | Obs. |
|---|---|---|---|---|
| FQ1 (Sep–Nov) | 0.9864 | -1.4% | In line with trend | 18 |
| FQ2 (Dec–Feb) | 0.9775 | -2.2% | In line with trend | 17 |
| FQ3 (Mar–May) | 0.9788 | -2.1% | In line with trend | 17 |
| FQ4 (Jun–Aug) | 1.0153 | +1.5% | In line with trend | 17 |
How Spending Drives Revenue
Want this analysis for your portfolio?
I build custom revenue intelligence reports for investors and companies using SEC filing data, econometric modeling, and AI-powered insights.
Get in Touch