Ecolab Inc. ECL
Revenue Intelligence Report • 70 quarters of SEC filing data • Updated 2026-03-15
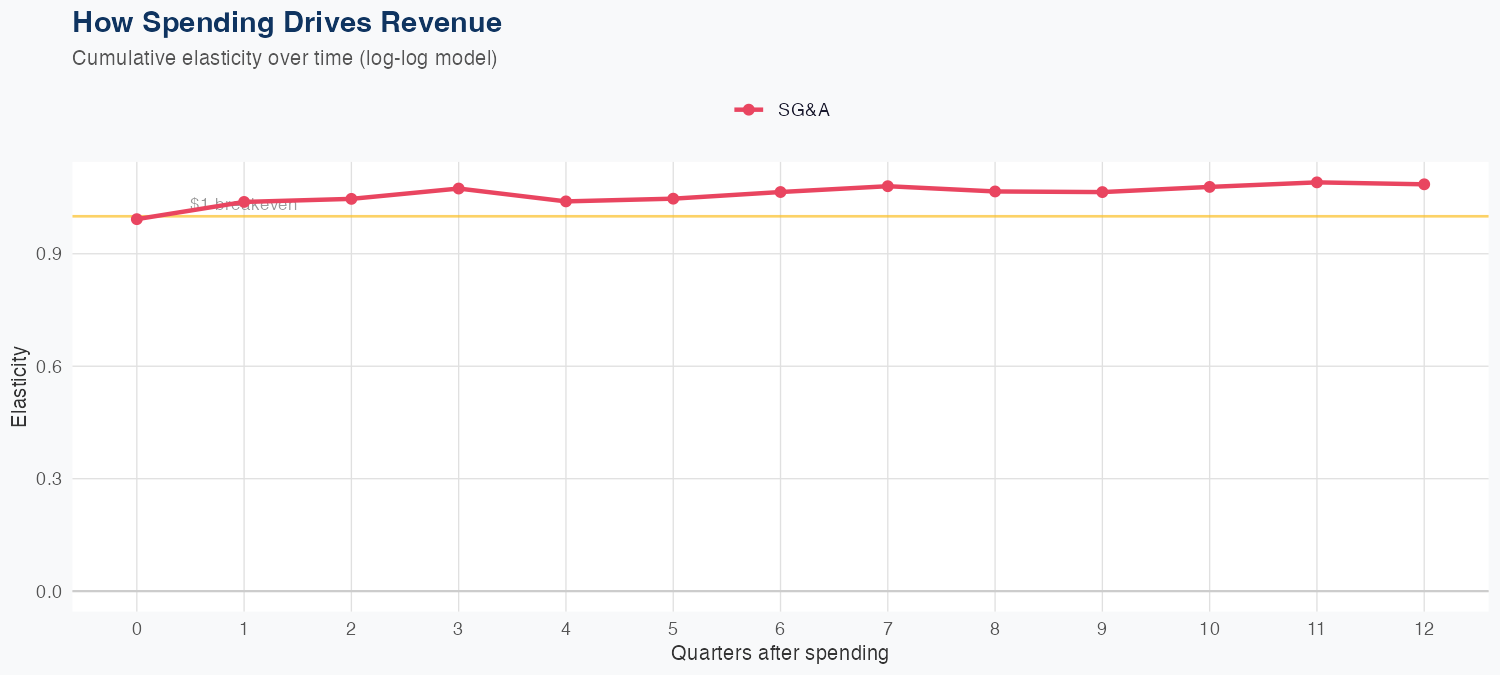
Revenue appears driven by SG&A spending, with an elasticity of 1.09 in the log-log model, meaning a 1% increase in SG&A is associated with about 1.09% higher revenue. The model shows solid predictive performance (3.1% MAPE across 70 quarters) and a holdout error of 2.6% (predicted $4.1B vs actual $4.2B), supporting reliable short-term forecasts. The FY plan calls for roughly $16B in revenue, about 1.5% year-over-year growth, indicating continued scale benefits tied to ongoing SG&A investments. This yields a positive ROI signal for SG&A spending under current cost structures, with the outlook hinging on maintaining pricing and margin discipline while leveraging efficiency gains in spend.
Investment Thesis
The econometric model achieves strong accuracy (3.1% MAPE), suggesting Ecolab Inc.'s revenue trajectory is well-characterized by its spending patterns. Sales & marketing spend shows a 1.09x elasticity, suggesting effective go-to-market execution.
Revenue Forecast
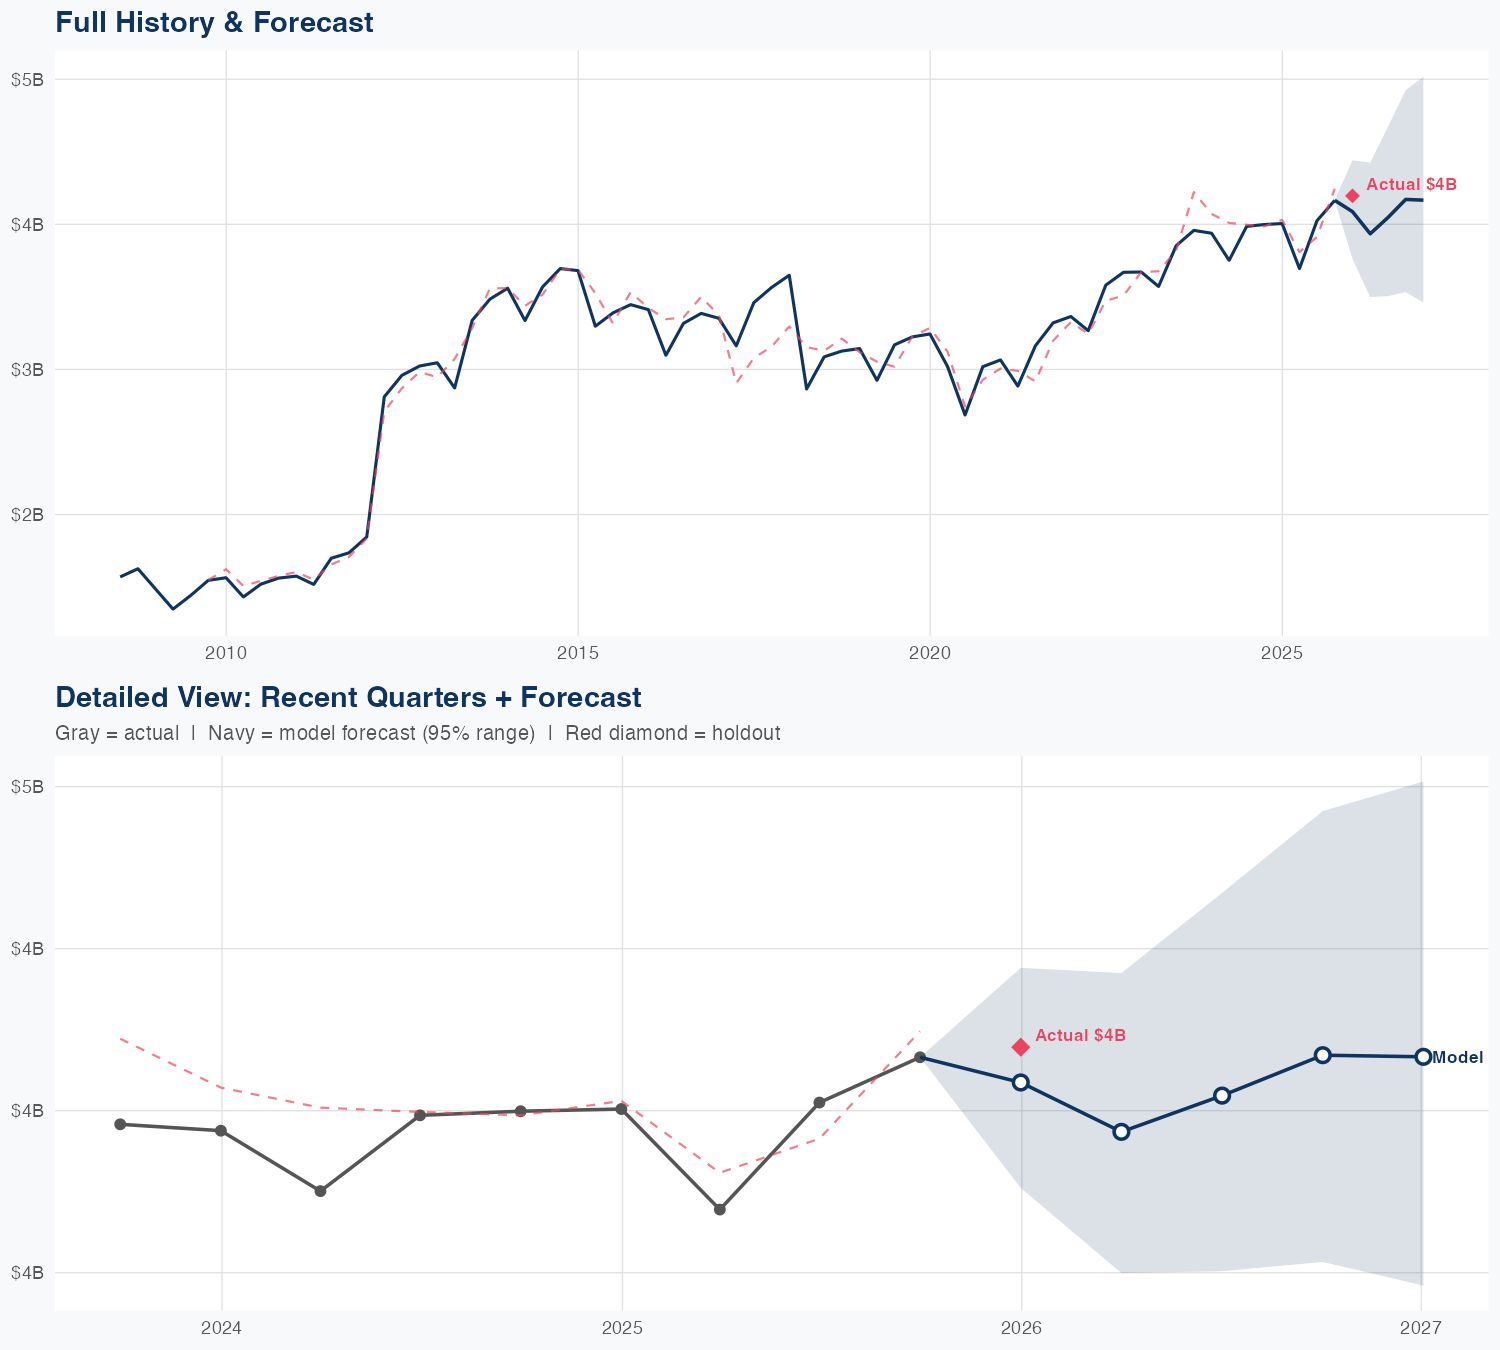
Quarterly Detail
| Quarter | Model Forecast | Actual | 95% Range | YoY Growth | Status |
|---|---|---|---|---|---|
| Q4 2025 | $4.1B | $4.2B | $3.8B – $4.4B | +2.1% | ✓ In range |
| Q2 2026 | $3.9B | $3.5B – $4.4B | +6.5% | ||
| Q3 2026 | $4.0B | $3.5B – $4.7B | +0.5% | ||
| Q4 2026 | $4.2B | $3.5B – $4.9B | +0.2% | ||
| Q1 2027 | $4.2B | $3.5B – $5.0B | -0.7% |
Seasonal Factors
| Fiscal Quarter | Seasonal Factor | vs Trend | Interpretation | Obs. |
|---|---|---|---|---|
| FQ1 (Sep–Nov) | 0.9994 | -0.1% | In line with trend | 17 |
| FQ2 (Dec–Feb) | 0.9998 | -0.0% | In line with trend | 17 |
| FQ3 (Mar–May) | 0.9673 | -3.3% | -3.3% below trend | 16 |
| FQ4 (Jun–Aug) | 1.0215 | +2.2% | In line with trend | 16 |
How Spending Drives Revenue
Want this analysis for your portfolio?
I build custom revenue intelligence reports for investors and companies using SEC filing data, econometric modeling, and AI-powered insights.
Get in Touch