Henry Schein, Inc. HSIC
Revenue Intelligence Report • 48 quarters of SEC filing data • Updated 2026-03-15
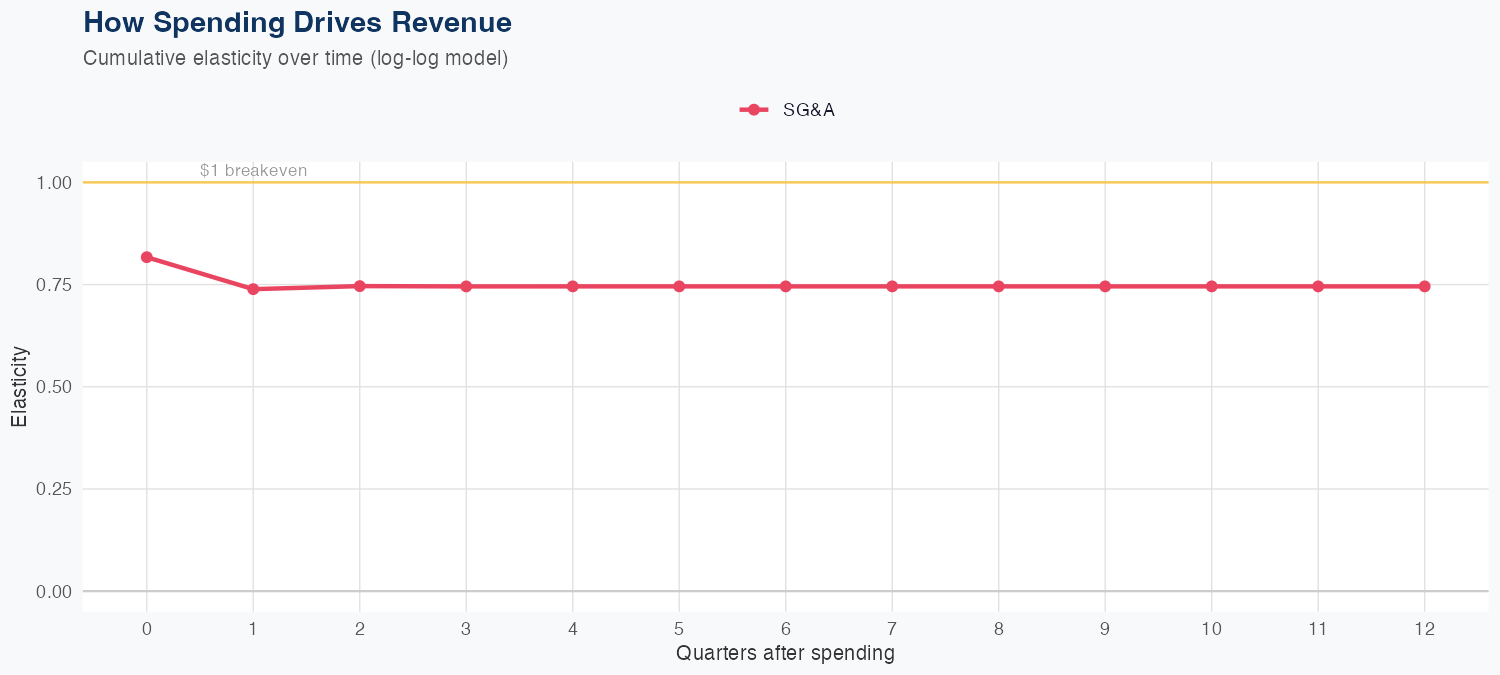
SG&A investments drive revenue, with an elasticity of 0.63% in revenue for every 1% change in SG&A, while R&D impact is not quantified in this dataset. The model, based on a log-log specification, shows credible predictive performance with 9.7% MAPE and a holdout error of about 1.1% on a 3.4B quarterly baseline, supported by 48 quarters of data. The FY revenue forecast is about $13B, down 0.9% YoY, signaling a modest revenue decline despite ongoing SG&A activity. For investors, the ROI of SG&A spend appears positive but modest, underscoring the need for spending efficiency and cost discipline given the absence of quantified R&D gains and the modest top-line outlook.
Investment Thesis
At 9.7% MAPE, the model captures Henry Schein, Inc.'s broad revenue trajectory, though quarterly variability suggests sensitivity to external factors. Sales & marketing spend shows a 0.63x elasticity, suggesting effective go-to-market execution.
Revenue Forecast
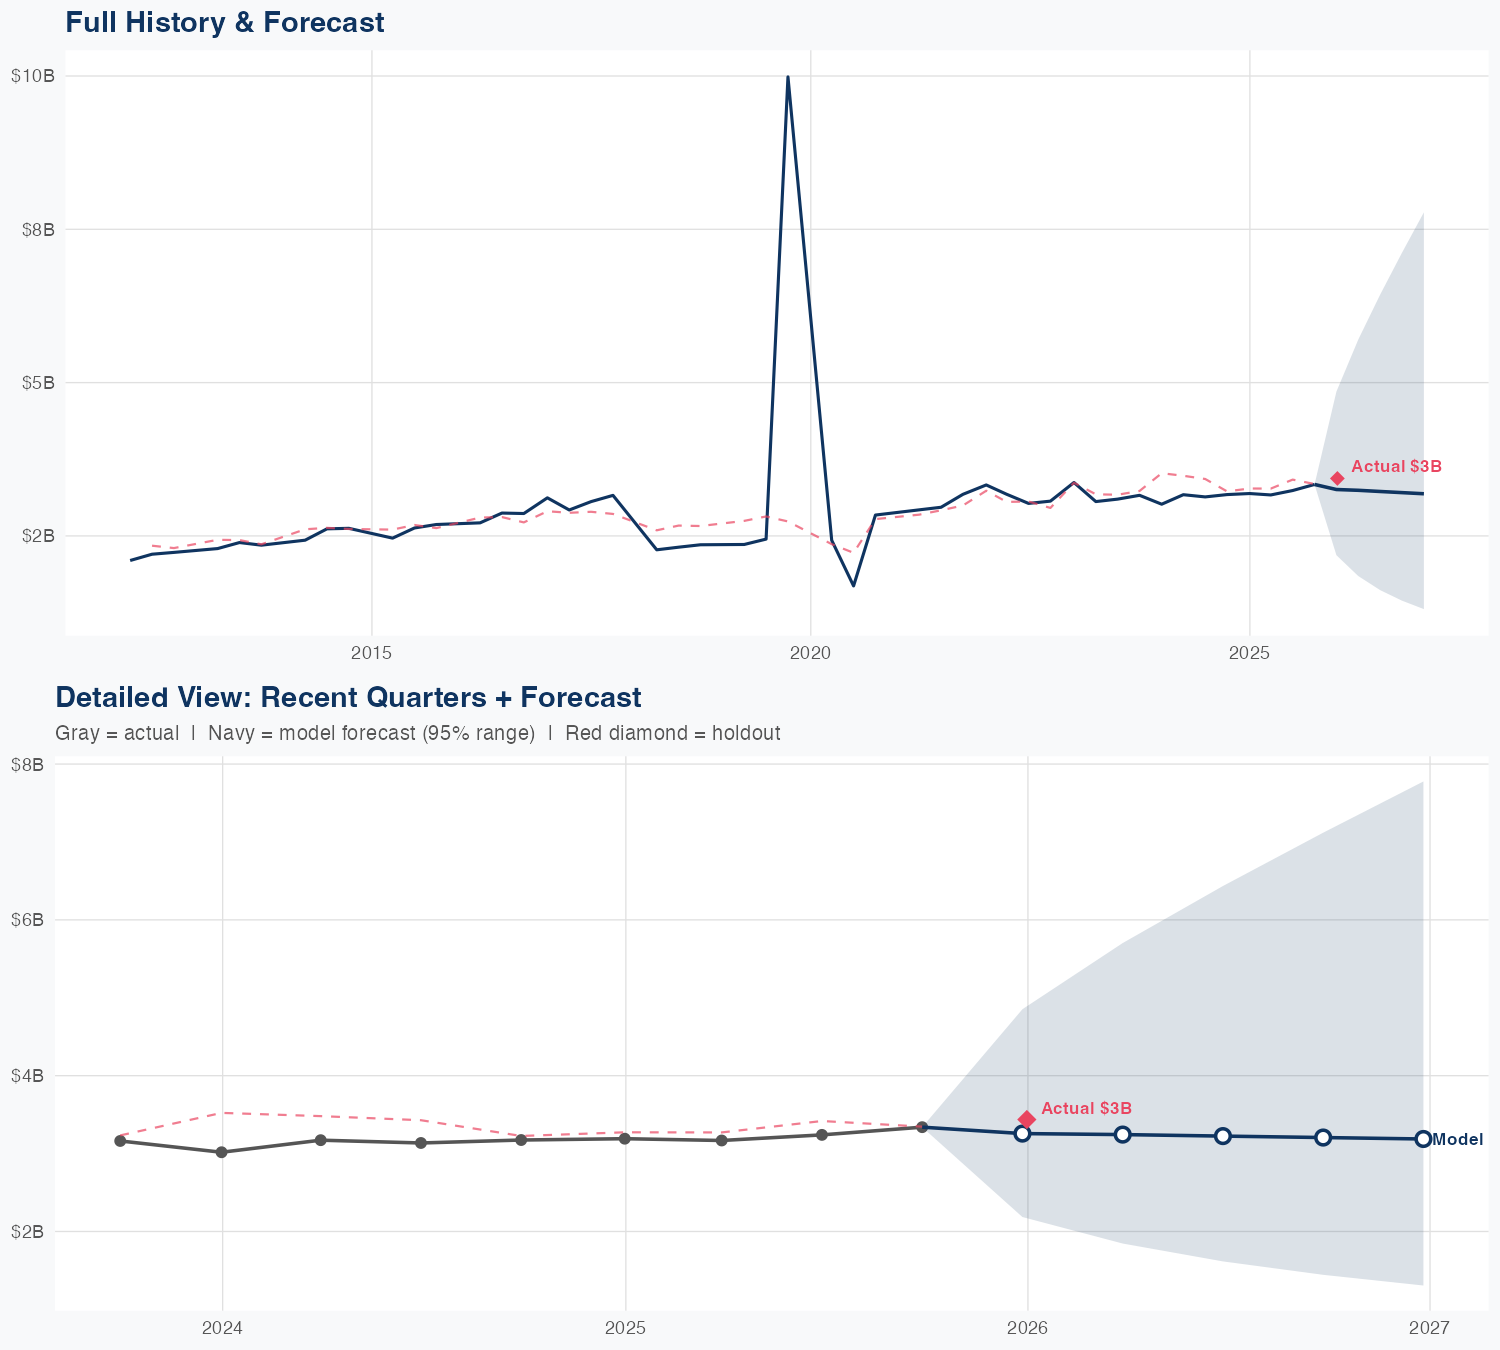
Quarterly Detail
| Quarter | Model Forecast | Actual | 95% Range | YoY Growth | Status |
|---|---|---|---|---|---|
| Q4 2025 | $3.4B | $3.4B | $2.4B – $4.9B | +6.5% | ✓ In range |
| Q1 2026 | $3.3B | $1.9B – $5.5B | +2.7% | ||
| Q2 2026 | $3.2B | $1.7B – $6.1B | +0.2% | ||
| Q3 2026 | $3.3B | $1.6B – $6.9B | -0.7% | ||
| Q4 2026 | $3.3B | $1.4B – $7.4B | -5.4% |
Seasonal Factors
| Fiscal Quarter | Seasonal Factor | vs Trend | Interpretation | Obs. |
|---|---|---|---|---|
| FQ1 (Sep–Nov) | 0.948 | -5.2% | -5.2% below trend | 13 |
| FQ2 (Dec–Feb) | 1.1466 | +14.7% | +14.7% above trend | 6 |
| FQ3 (Mar–May) | 0.9303 | -7.0% | -7.0% below trend | 13 |
| FQ4 (Jun–Aug) | 0.98 | -2.0% | In line with trend | 13 |
How Spending Drives Revenue
Want this analysis for your portfolio?
I build custom revenue intelligence reports for investors and companies using SEC filing data, econometric modeling, and AI-powered insights.
Get in Touch