Humana Inc. HUM
Revenue Intelligence Report • 70 quarters of SEC filing data • Updated 2026-03-15
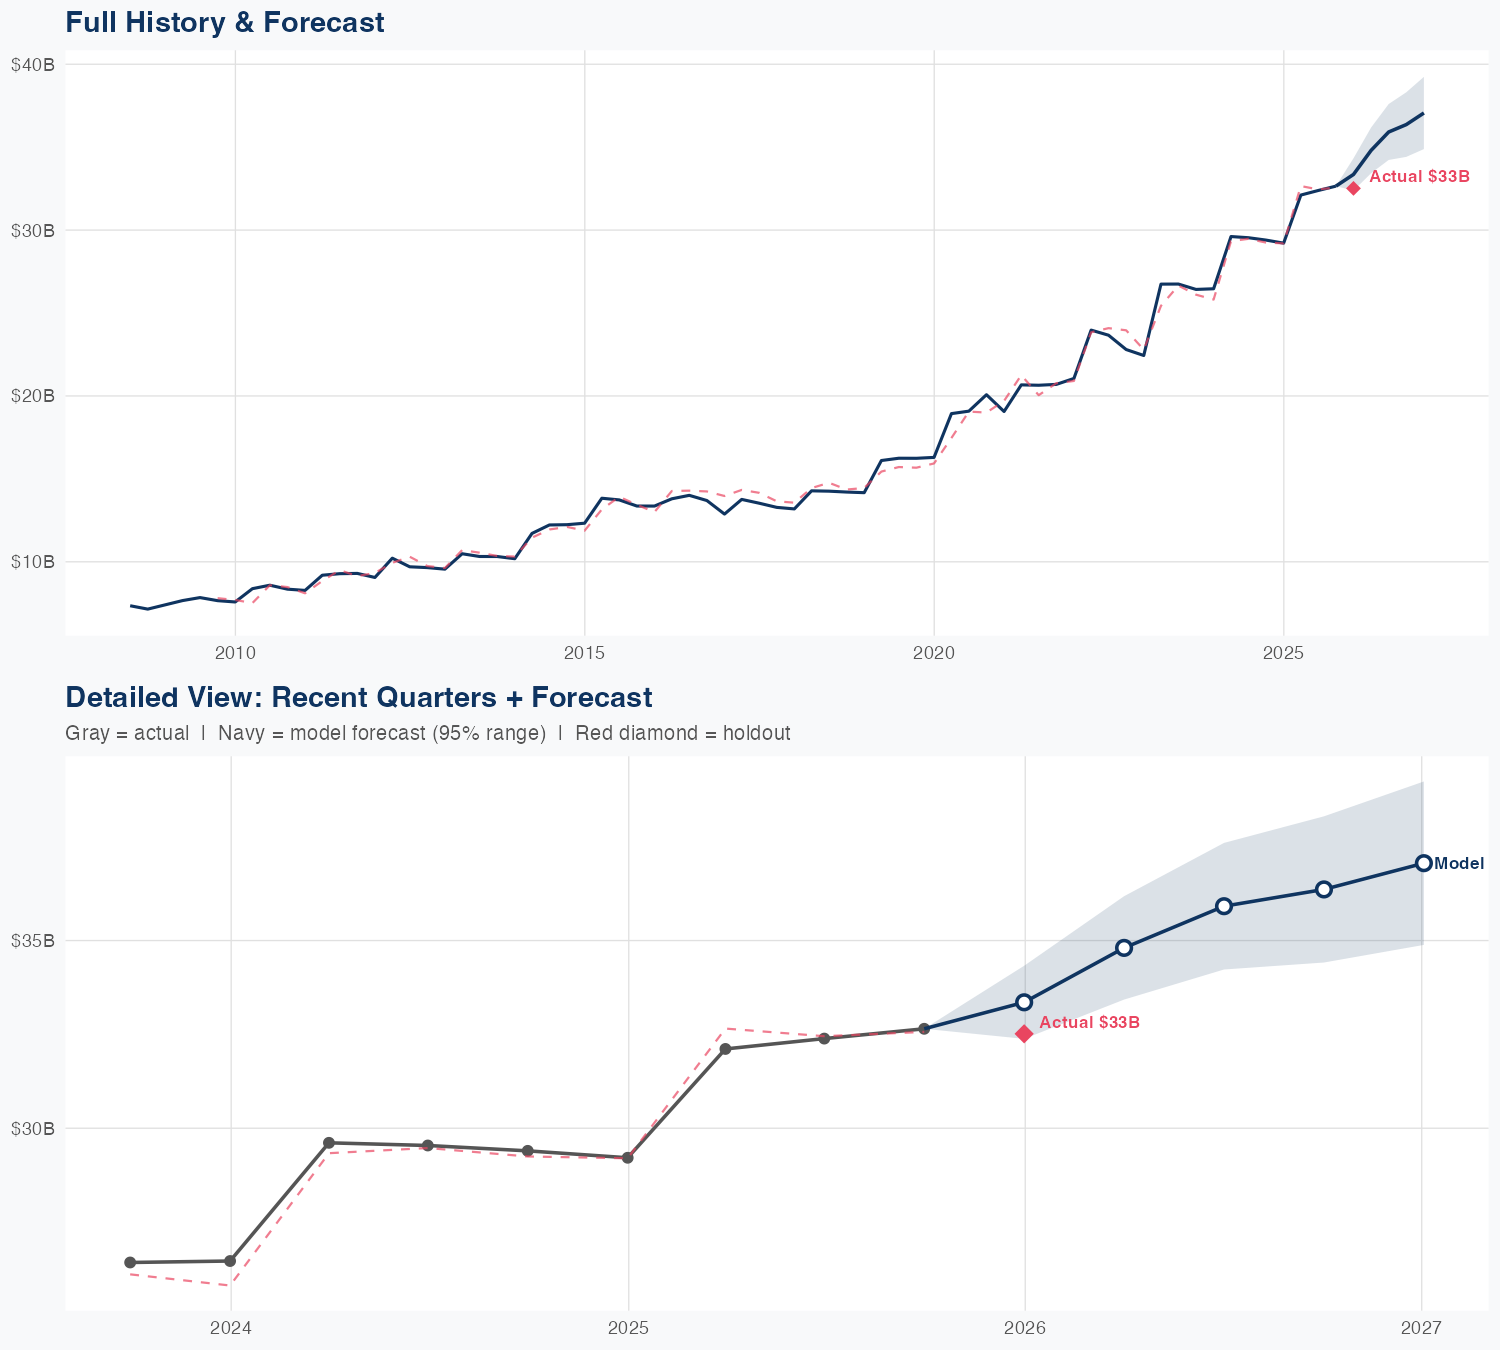
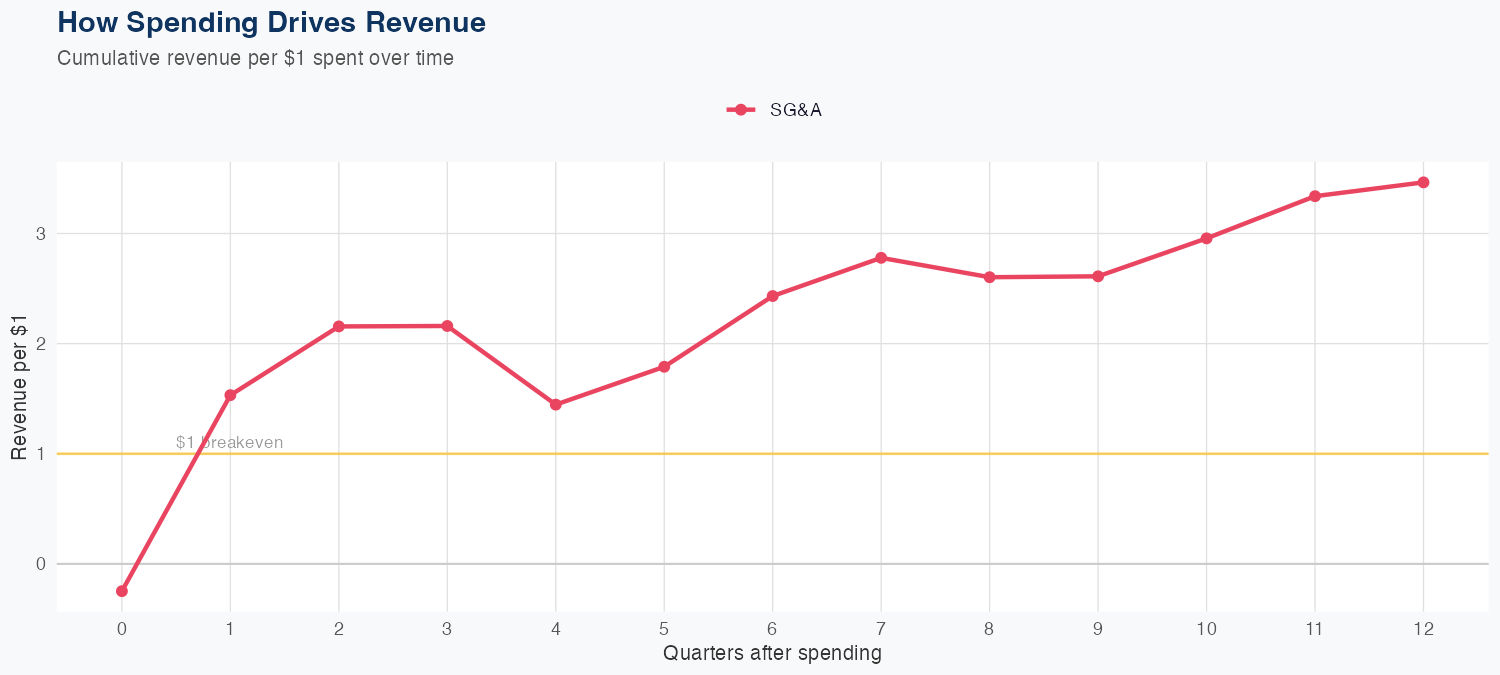
Humana posted FY revenue of $144B, up 11.2% YoY, and our econometric model flags efficient SG&A as a key growth lever, with SG&A generating $3.46 in revenue per $1 spent. That ROI implies growth derives from smarter marketing and enrollment management—primarily Medicare Advantage enrollment and persistency—rather than aggressive price hikes. Holdout testing shows the model forecast $33.4B vs actual $32.5B (2.6% error), while overall MAPE runs at 2.5%, underscoring solid reliability but exposure to policy or competitive shifts. At roughly 11%, the pace heightens regulatory and margin risk if MA payments or risk adjustments tighten, making continued SG&A efficiency and favorable enrollment economics critical to sustaining the growth trajectory.
Investment Thesis
Our ARDL model tracks Humana Inc.'s revenue with exceptional precision (2.5% MAPE), indicating highly predictable cash flows. Each $1 of SG&A spending generates $3.46 in revenue, reflecting strong commercial efficiency.
Revenue Forecast
Quarterly Detail
| Quarter | Model Forecast | Actual | 95% Range | YoY Growth | Status |
|---|---|---|---|---|---|
| Q4 2025 | $33B | $33B | $32B – $34B | +14.2% | ✓ In range |
| Q2 2026 | $35B | $33B – $36B | +8.4% | ||
| Q3 2026 | $36B | $34B – $38B | +10.9% | ||
| Q4 2026 | $36B | $34B – $38B | +11.4% | ||
| Q1 2027 | $37B | $35B – $39B | +14.0% |
Seasonal Factors
| Fiscal Quarter | Seasonal Factor | vs Trend | Interpretation | Obs. |
|---|---|---|---|---|
| FQ1 (Sep–Nov) | 0.9965 | -0.3% | In line with trend | 17 |
| FQ2 (Dec–Feb) | 0.9874 | -1.3% | In line with trend | 17 |
| FQ3 (Mar–May) | 1.0223 | +2.2% | In line with trend | 16 |
| FQ4 (Jun–Aug) | 0.998 | -0.2% | In line with trend | 16 |
How Spending Drives Revenue
Want this analysis for your portfolio?
I build custom revenue intelligence reports for investors and companies using SEC filing data, econometric modeling, and AI-powered insights.
Get in Touch