Iron Mountain Inc IRM
Revenue Intelligence Report • 48 quarters of SEC filing data • Updated 2026-03-15
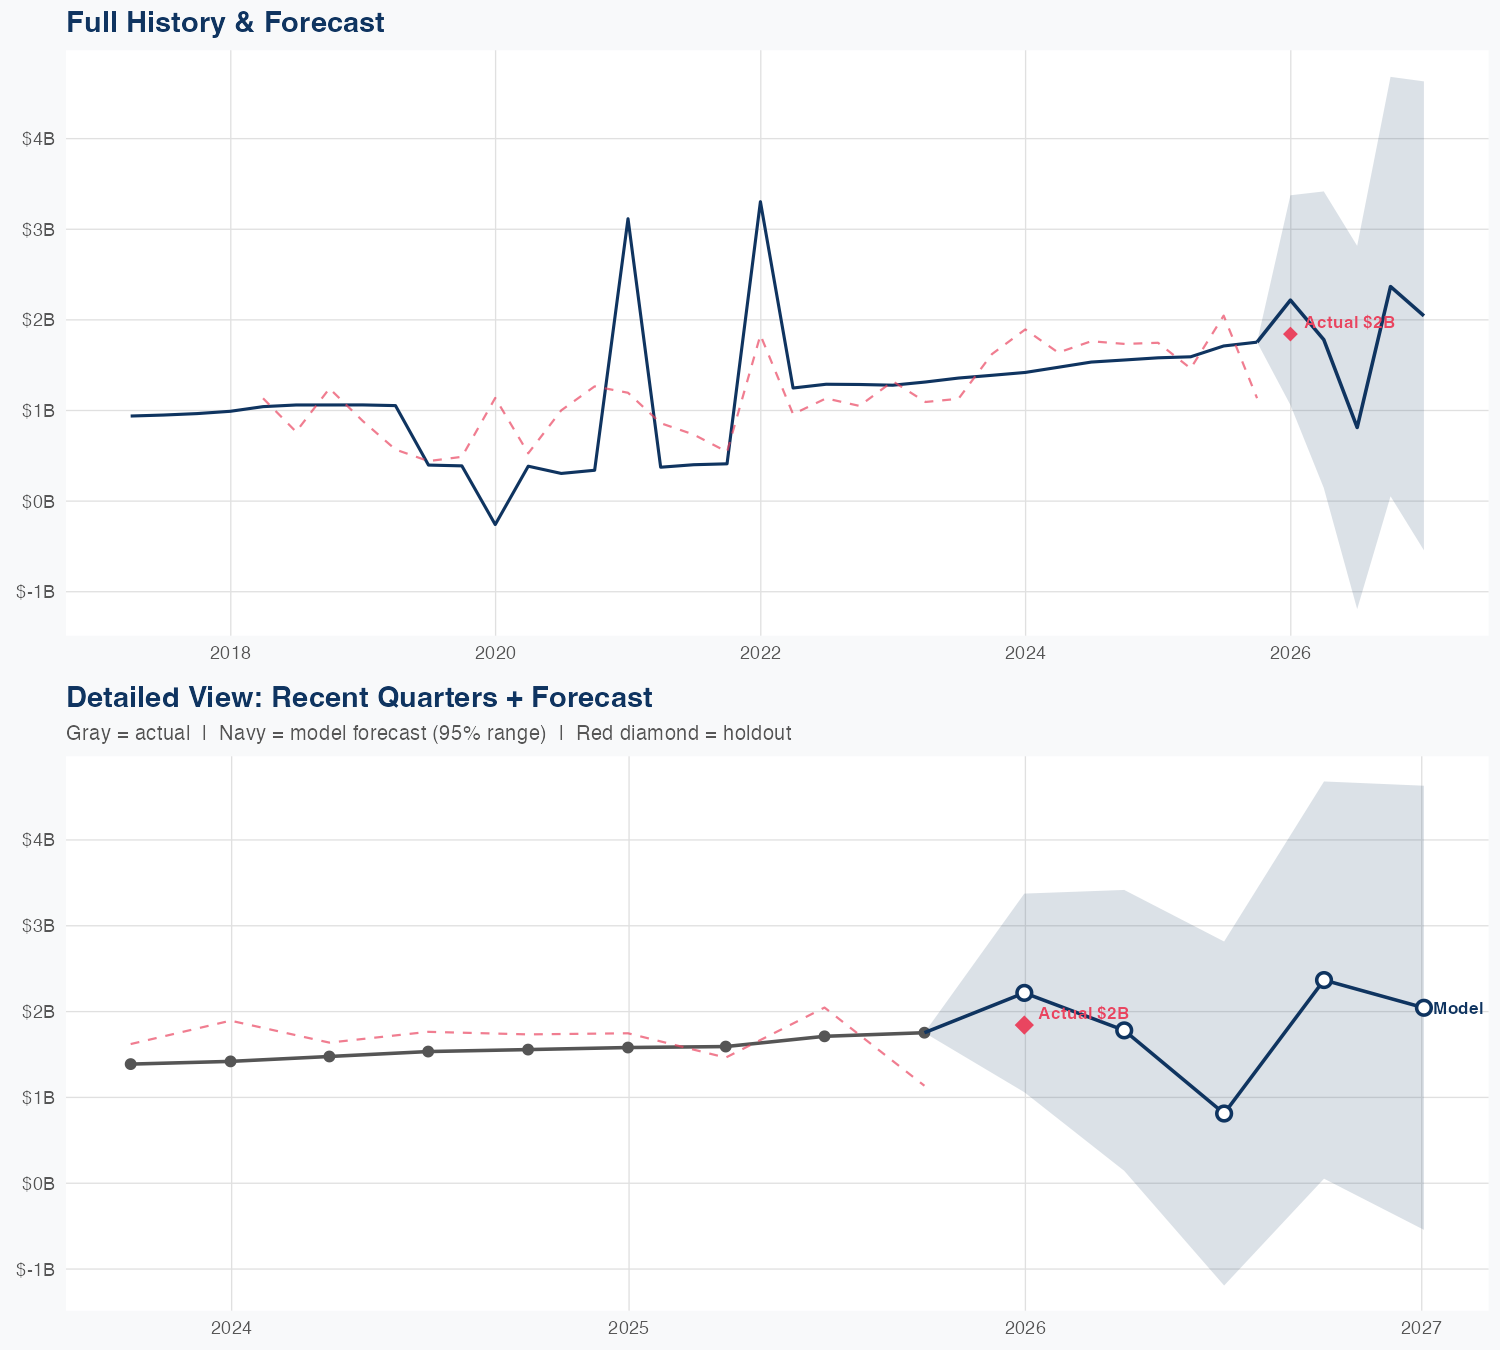
Latest quarterly revenue stood at $1.843 billion, underscoring a sizable recurring revenue base. In this model, SG&A spending is the primary revenue driver, with a long-run revenue multiplier of $10.60 for every $1 of SG&A invested. The model is linear with 30% MAPE accuracy; a holdout test predicted $1.8B of revenue vs actual $1.8B, a 1.4% error, which lends credibility to the forecast. The FY forecast calls for $8.4B in revenue, up 22.3% year over year, pointing to a favorable growth trajectory driven by efficient SG&A deployment.
Investment Thesis
At 30.0% MAPE, the model captures Iron Mountain Inc's broad revenue trajectory, though quarterly variability suggests sensitivity to external factors. Each $1 of SG&A spending generates $10.60 in revenue, reflecting strong commercial efficiency.
Revenue Forecast
Quarterly Detail
| Quarter | Model Forecast | Actual | 95% Range | YoY Growth | Status |
|---|---|---|---|---|---|
| Q4 2025 | $1.8B | $1.8B | $1.6B – $2.1B | +14.9% | ✓ In range |
| Q2 2026 | $2.1B | $1.8B – $2.5B | +33.1% | ||
| Q3 2026 | $2.0B | $1.6B – $2.4B | +15.7% | ||
| Q4 2026 | $2.1B | $1.6B – $2.6B | +21.5% | ||
| Q1 2027 | $2.2B | $1.7B – $2.8B | +19.9% |
Seasonal Factors
| Fiscal Quarter | Seasonal Factor | vs Trend | Interpretation | Obs. |
|---|---|---|---|---|
| FQ1 (Sep–Nov) | 1.0152 | +1.5% | In line with trend | 11 |
| FQ2 (Dec–Feb) | 0.9669 | -3.3% | -3.3% below trend | 9 |
| FQ3 (Mar–May) | 1.0157 | +1.6% | In line with trend | 11 |
| FQ4 (Jun–Aug) | 1.0159 | +1.6% | In line with trend | 11 |
How Spending Drives Revenue

Want this analysis for your portfolio?
I build custom revenue intelligence reports for investors and companies using SEC filing data, econometric modeling, and AI-powered insights.
Get in Touch