Linde Plc LIN
Revenue Intelligence Report • 32 quarters of SEC filing data • Updated 2026-03-15
Linde Plc has a forecasted full-year revenue of $35B, a +3.6% year-over-year change, based on 32 quarters of SEC filing data. Key revenue drivers include SG&A (elasticity 0.89x). The ARDL model achieves strong accuracy at 1.9% MAPE.
Investment Thesis
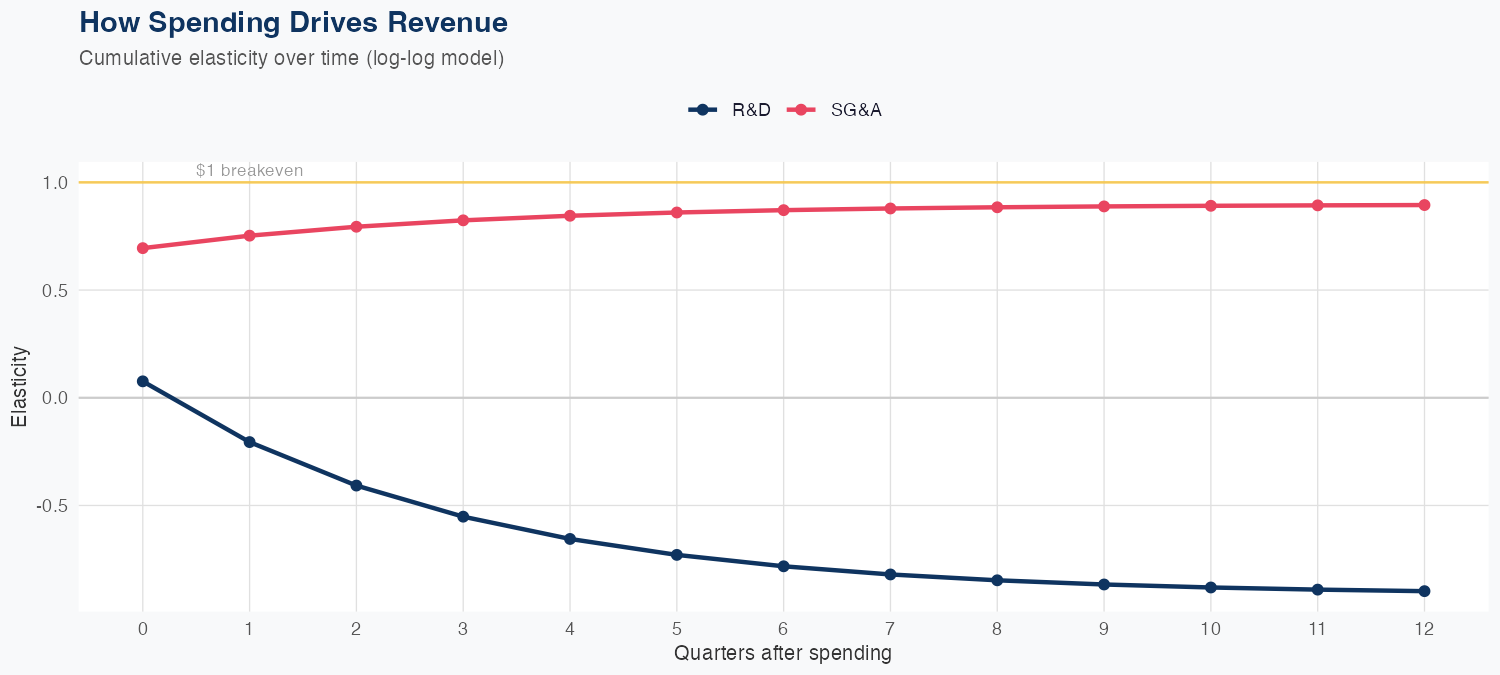
Our ARDL model tracks Linde Plc's revenue with exceptional precision (1.9% MAPE), indicating highly predictable cash flows. R&D spending currently shows a negative elasticity (-0.90x), which can indicate heavy investment in long-cycle initiatives not yet reflected in revenue. Sales & marketing spend shows a 0.89x elasticity, suggesting effective go-to-market execution.
Revenue Forecast
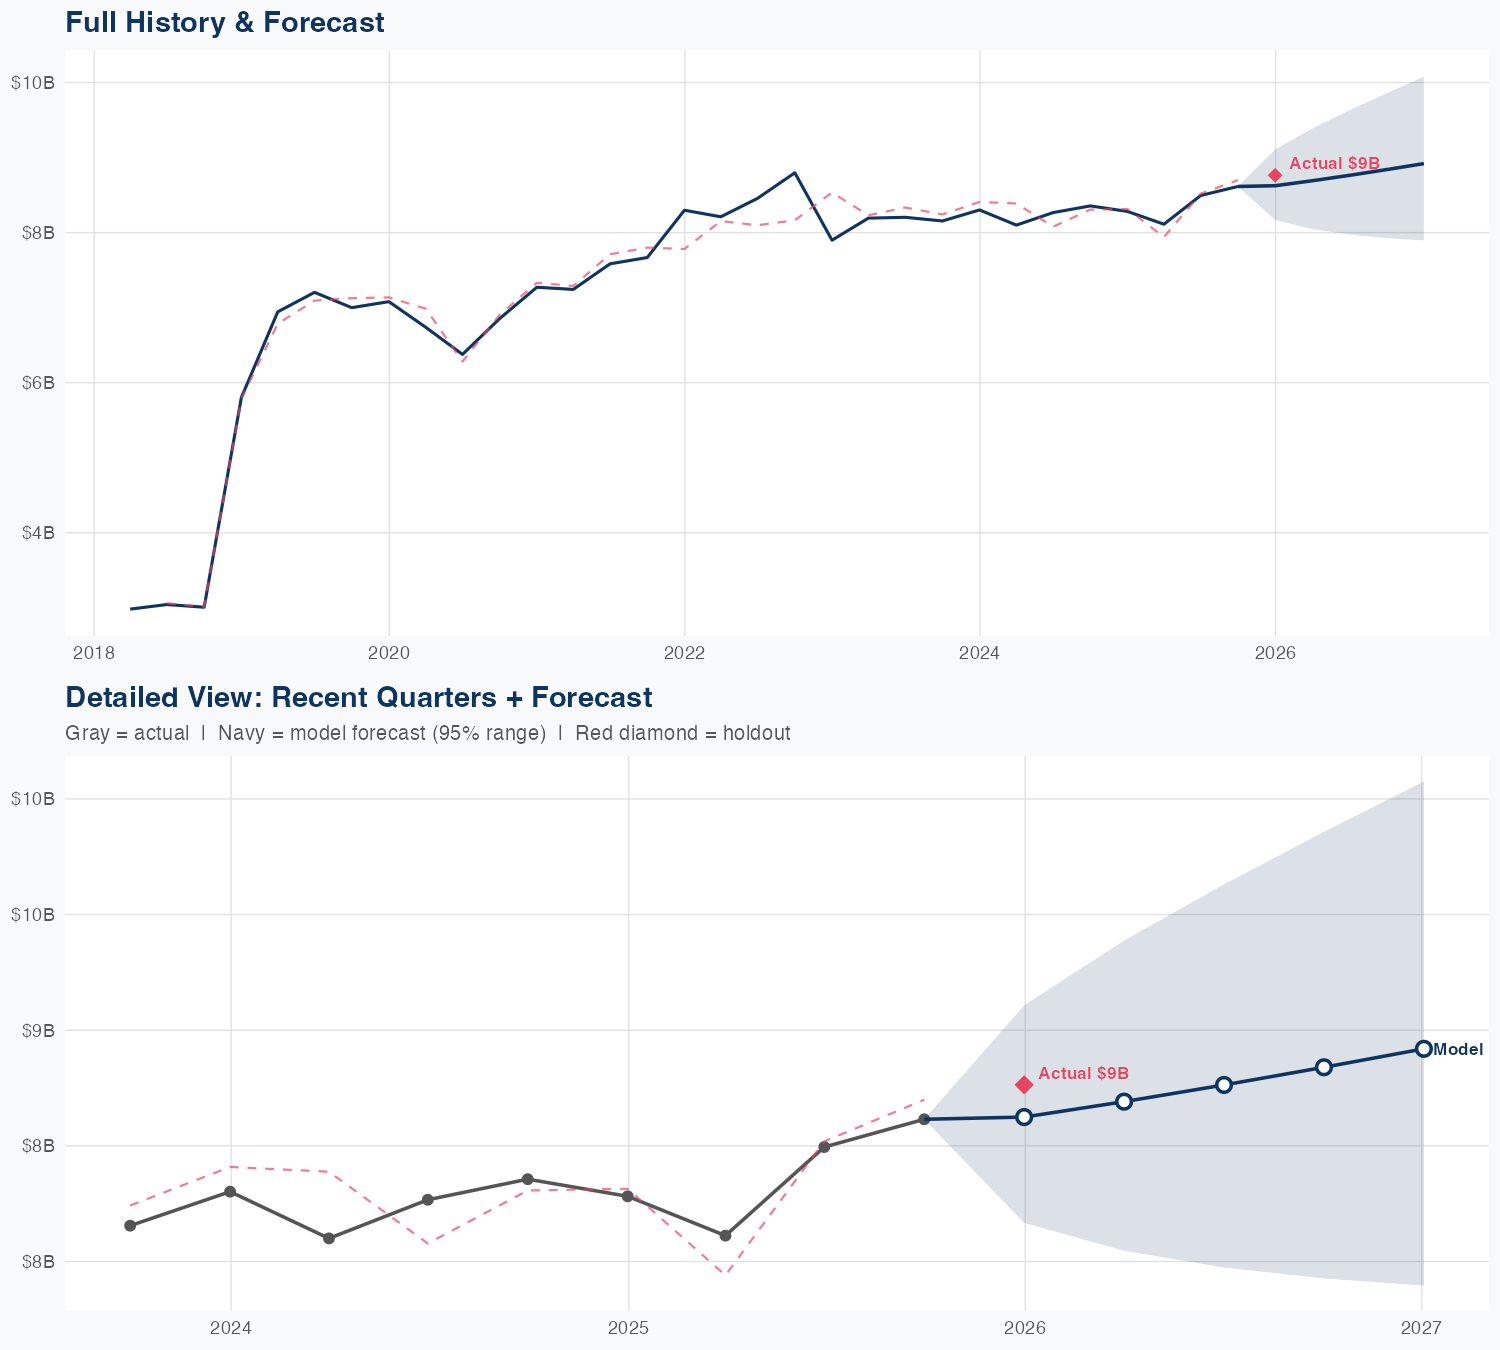
Quarterly Detail
| Quarter | Model Forecast | Actual | 95% Range | YoY Growth | Status |
|---|---|---|---|---|---|
| Q4 2025 | $8.6B | $8.8B | $8.2B – $9.1B | +4.1% | ✓ In range |
| Q2 2026 | $8.7B | $8.0B – $9.4B | +7.1% | ||
| Q3 2026 | $8.8B | $8.0B – $9.6B | +3.2% | ||
| Q4 2026 | $8.8B | $7.9B – $9.9B | +2.6% | ||
| Q1 2027 | $8.9B | $7.9B – $10B | +1.8% |
Seasonal Factors
| Fiscal Quarter | Seasonal Factor | vs Trend | Interpretation | Obs. |
|---|---|---|---|---|
| FQ1 (Sep–Nov) | 0.9926 | -0.7% | In line with trend | 8 |
| FQ2 (Dec–Feb) | 0.9961 | -0.4% | In line with trend | 8 |
| FQ3 (Mar–May) | 0.9954 | -0.5% | In line with trend | 7 |
| FQ4 (Jun–Aug) | 1.0152 | +1.5% | In line with trend | 8 |
How Spending Drives Revenue
Want this analysis for your portfolio?
I build custom revenue intelligence reports for investors and companies using SEC filing data, econometric modeling, and AI-powered insights.
Get in Touch