Sba Communications Corporation SBAC
Revenue Intelligence Report • 66 quarters of SEC filing data • Updated 2026-03-15
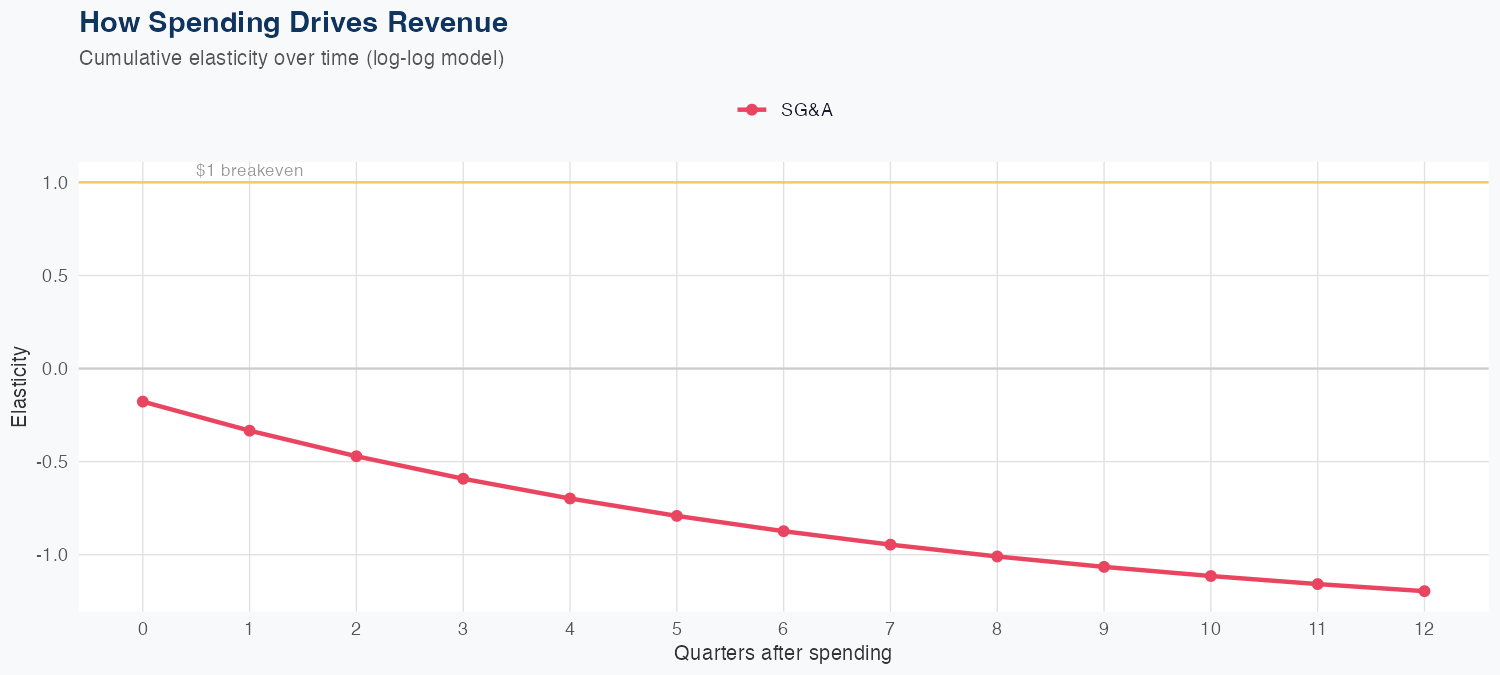
With the latest quarterly revenue of 720 million, the model shows SG&A spending has a modest elasticity on revenue: a 1% increase in SG&A is associated with about a 0.07% rise in revenue, implying limited SG&A ROI under this framework. The analysis uses a log-log specification and achieves a holdout MAPE of 2.1%, with the most recent quarter’s forecast of 737 million vs. actual 720 million, an approximate -2.5% error, indicating solid short-term predictive accuracy. For the full year, the forecast calls for 2,996 million in revenue, up 6.4% year over year, signaling modest but positive growth. Given the small revenue response to SG&A, investors may want to focus on efficiency gains or pursue other drivers of revenue beyond SG&A to improve ROI and sustain the outlook.
Investment Thesis
Our ARDL model tracks Sba Communications Corporation's revenue with exceptional precision (2.1% MAPE), indicating highly predictable cash flows. Sales & marketing spend shows a 0.07x elasticity, suggesting effective go-to-market execution.
Revenue Forecast
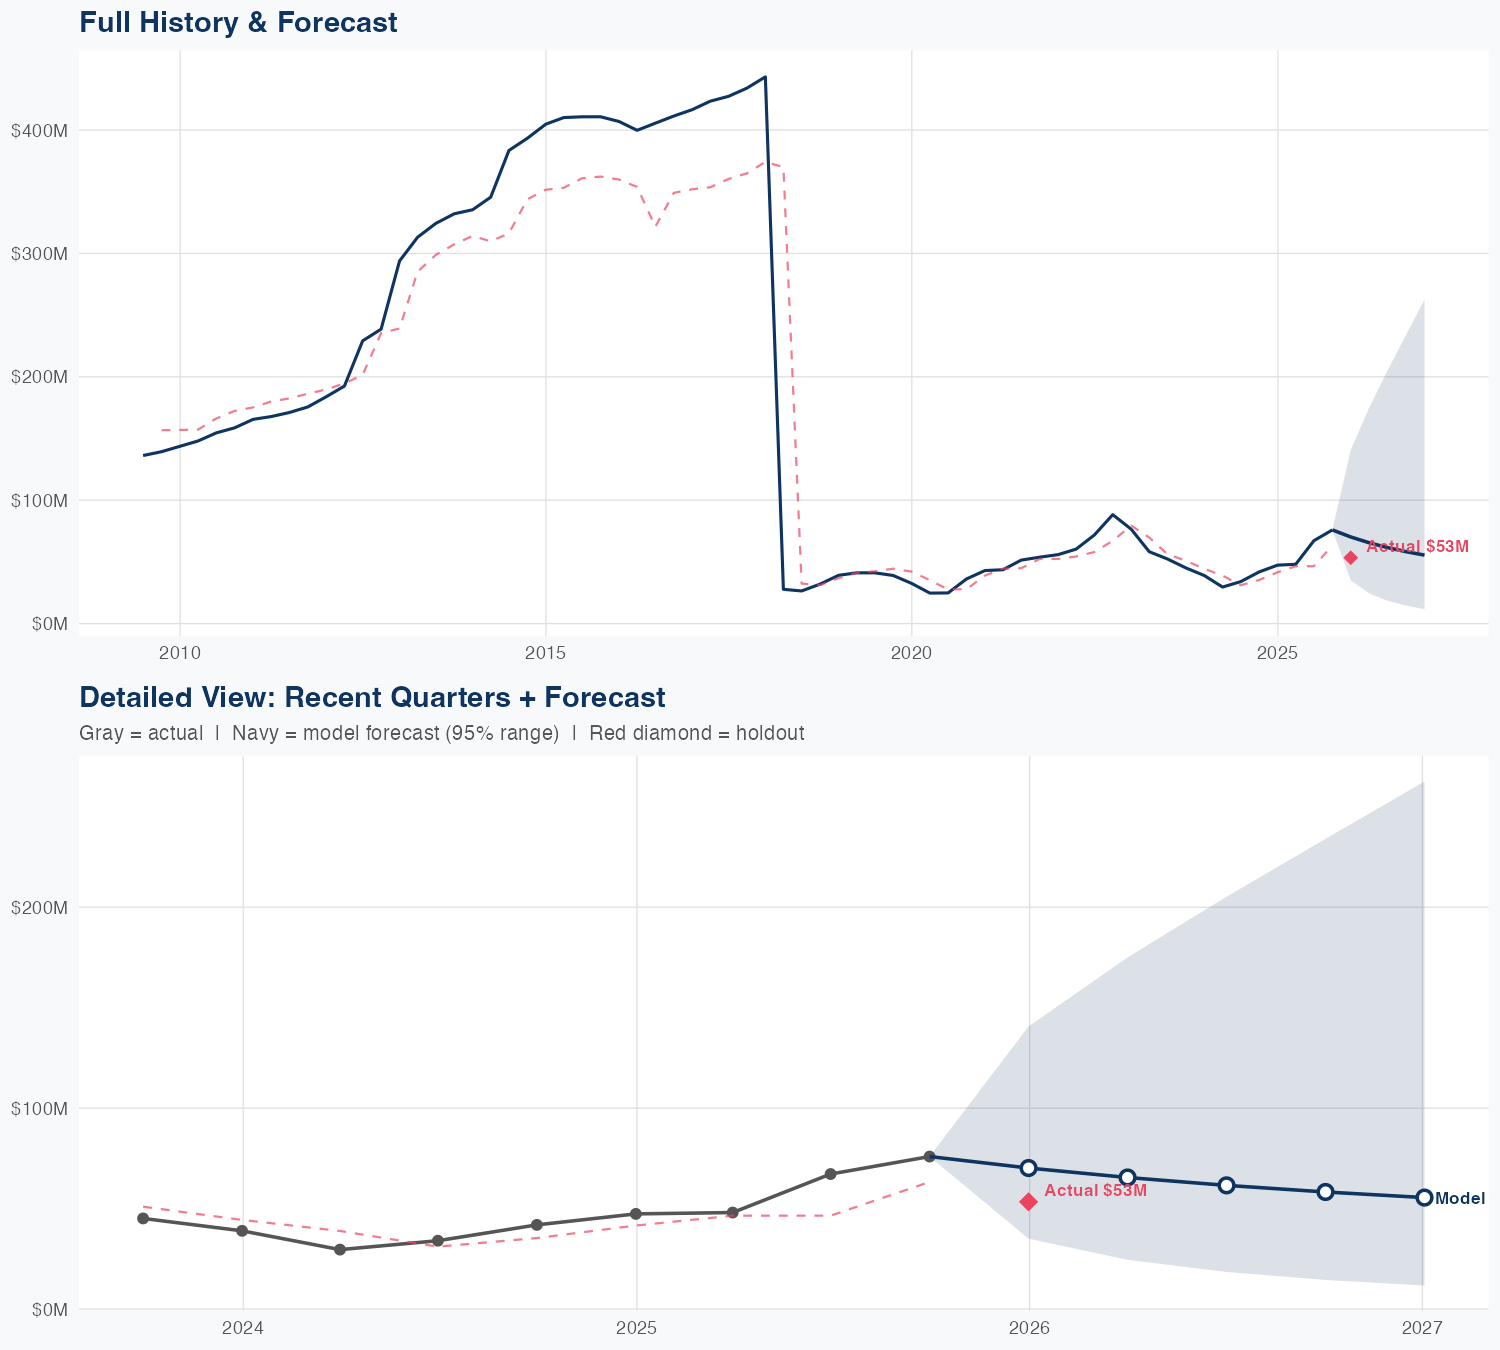
Quarterly Detail
| Quarter | Model Forecast | Actual | 95% Range | YoY Growth | Status |
|---|---|---|---|---|---|
| Q4 2025 | $737B | $720B | $689B – $789B | +6.3% | ✓ In range |
| Q2 2026 | $742B | $674B – $817B | +11.7% | ||
| Q3 2026 | $747B | $664B – $840B | +6.9% | ||
| Q4 2026 | $751B | $656B – $860B | +2.6% | ||
| Q1 2027 | $756B | $650B – $880B | +5.0% |
Seasonal Factors
| Fiscal Quarter | Seasonal Factor | vs Trend | Interpretation | Obs. |
|---|---|---|---|---|
| FQ1 (Sep–Nov) | 0.9965 | -0.4% | In line with trend | 17 |
| FQ2 (Dec–Feb) | 0.9953 | -0.5% | In line with trend | 16 |
| FQ3 (Mar–May) | 0.9954 | -0.5% | In line with trend | 16 |
| FQ4 (Jun–Aug) | 0.9936 | -0.6% | In line with trend | 16 |
How Spending Drives Revenue
Want this analysis for your portfolio?
I build custom revenue intelligence reports for investors and companies using SEC filing data, econometric modeling, and AI-powered insights.
Get in Touch