Welltower Inc. WELL
Revenue Intelligence Report • 66 quarters of SEC filing data • Updated 2026-03-15
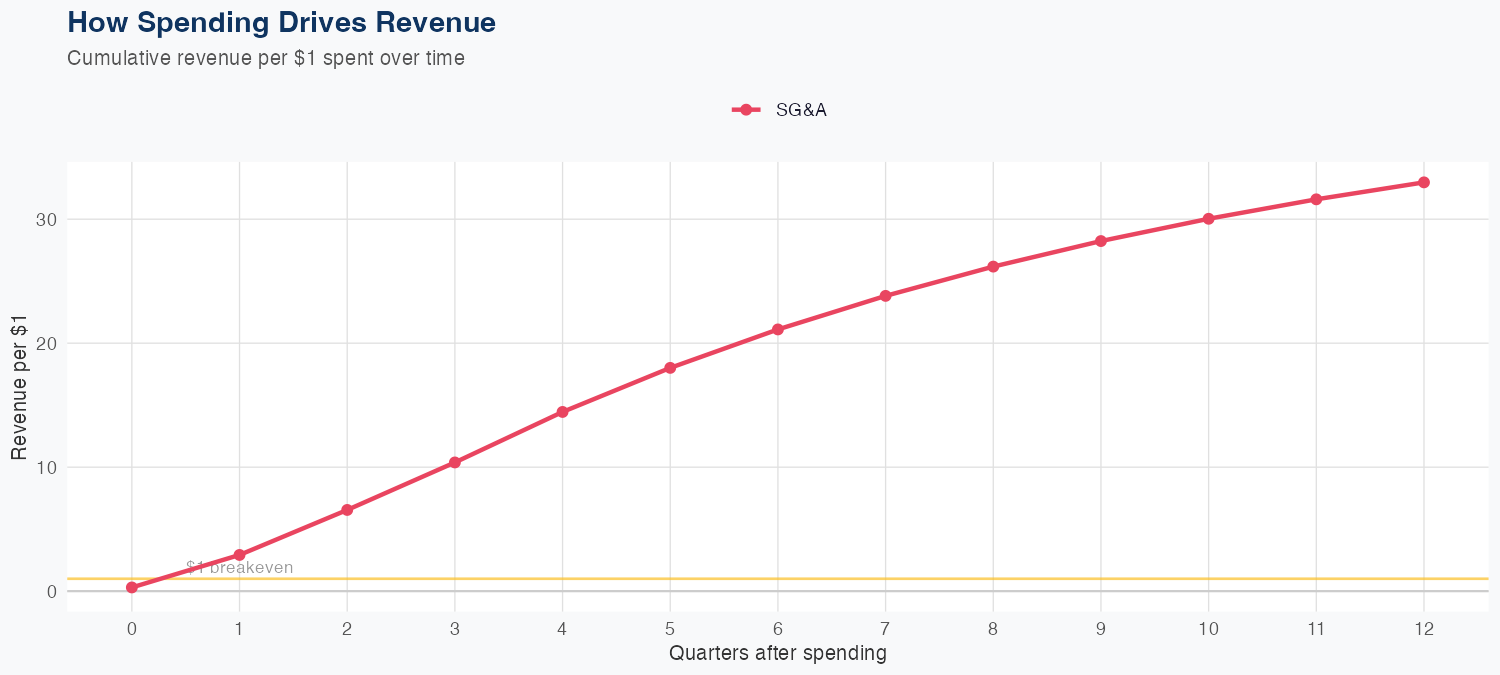
Revenue growth is driven by Welltower's core healthcare real estate portfolio and the stability of rent-backed cash flows. Welltower Inc. shows a high return on SG&A investments, with $1 of SG&A spending generating $33.25 of long-run revenue. The revenue model is linear with a 6.5% MAPE, though a holdout test predicting $2.8B versus actual $3.2B yielded about a 12.9% error. The full-year forecast calls for roughly $12B in revenue, up 12.3% year over year, signaling a healthy outlook supported by efficient cost-to-revenue dynamics.
Investment Thesis
The econometric model achieves strong accuracy (6.5% MAPE), suggesting Welltower Inc.'s revenue trajectory is well-characterized by its spending patterns. Each $1 of SG&A spending generates $33.25 in revenue, reflecting strong commercial efficiency.
Revenue Forecast
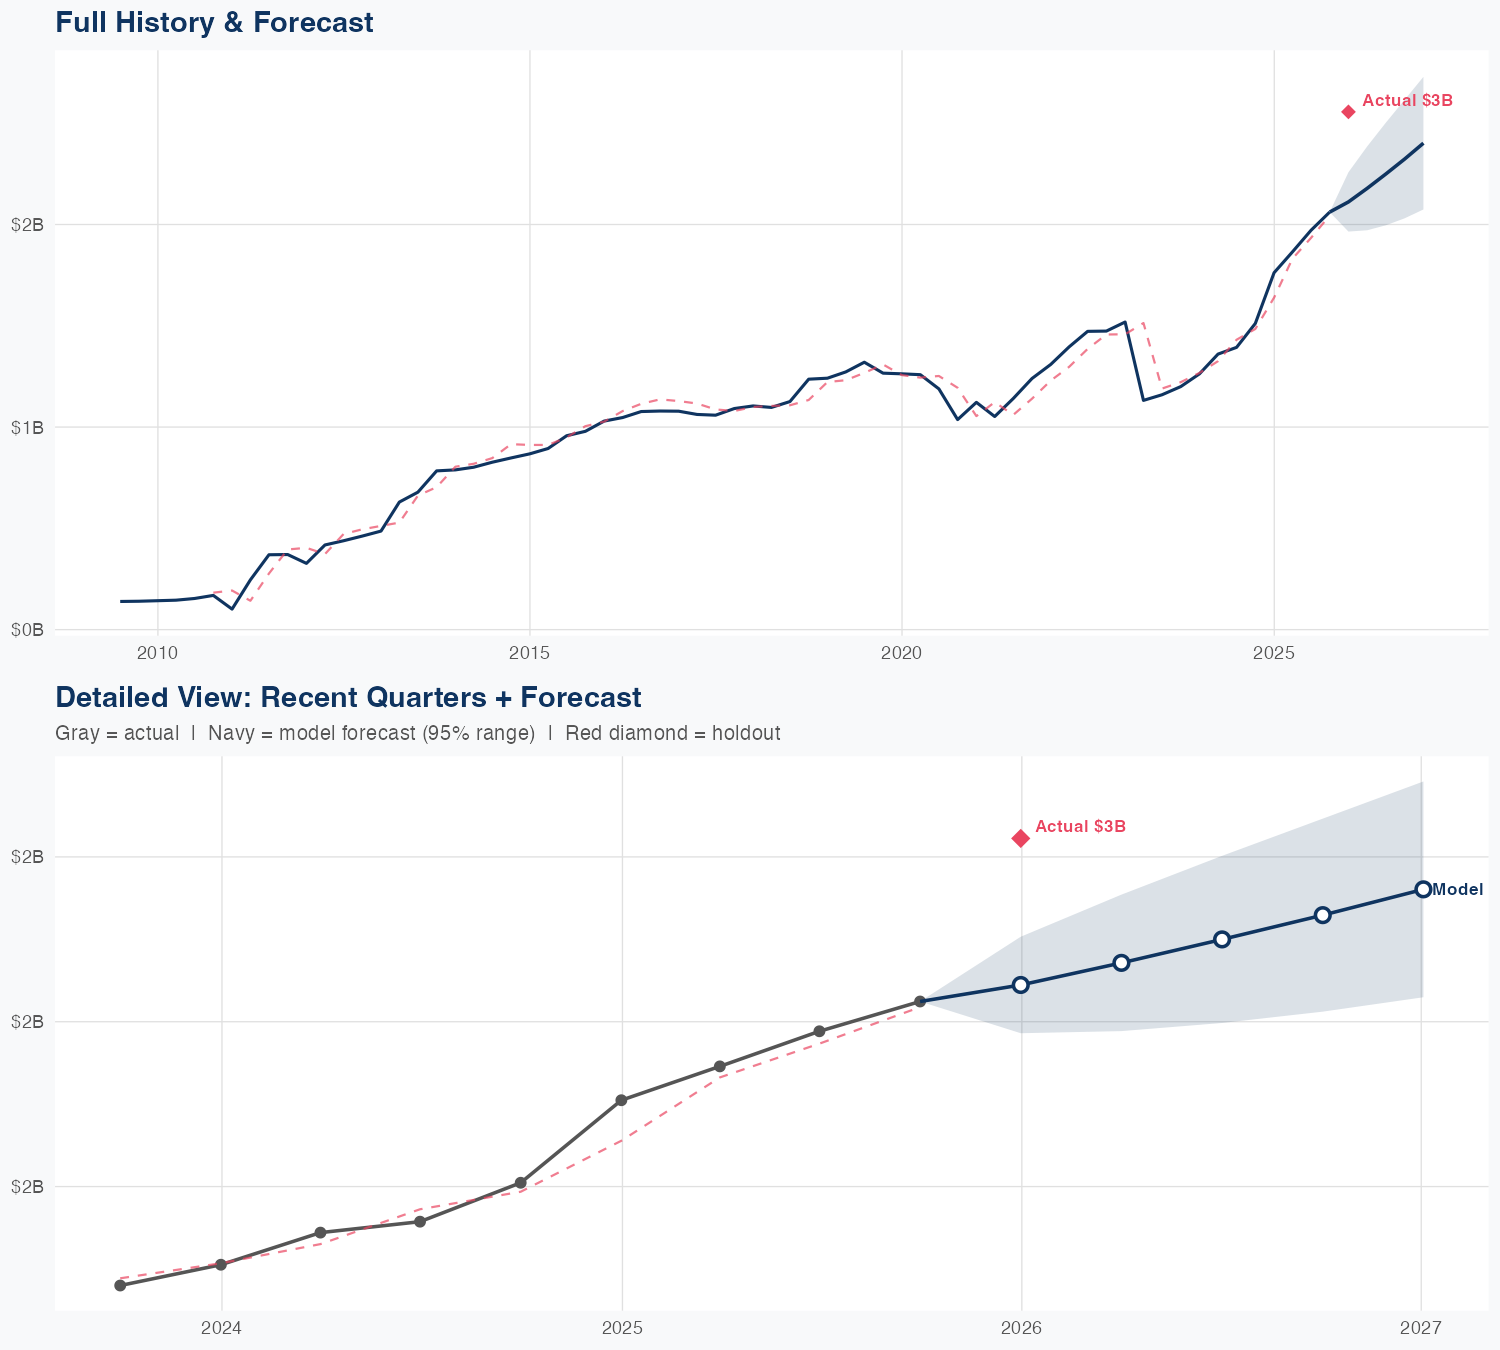
Quarterly Detail
| Quarter | Model Forecast | Actual | 95% Range | YoY Growth | Status |
|---|---|---|---|---|---|
| Q4 2025 | $2.8B | $3.2B | $2.7B – $2.9B | +23.1% | ✗ Outside range |
| Q2 2026 | $2.9B | $2.7B – $3.0B | +18.6% | ||
| Q3 2026 | $3.0B | $2.8B – $3.2B | +17.2% | ||
| Q4 2026 | $3.1B | $2.9B – $3.3B | +15.3% | ||
| Q1 2027 | $3.2B | $2.9B – $3.5B | +1.1% |
Seasonal Factors
| Fiscal Quarter | Seasonal Factor | vs Trend | Interpretation | Obs. |
|---|---|---|---|---|
| FQ1 (Sep–Nov) | 0.9742 | -2.6% | In line with trend | 16 |
| FQ2 (Dec–Feb) | 0.9981 | -0.2% | In line with trend | 16 |
| FQ3 (Mar–May) | 1.0042 | +0.4% | In line with trend | 15 |
| FQ4 (Jun–Aug) | 1.0068 | +0.7% | In line with trend | 15 |
How Spending Drives Revenue
Want this analysis for your portfolio?
I build custom revenue intelligence reports for investors and companies using SEC filing data, econometric modeling, and AI-powered insights.
Get in Touch