Everest Group, Ltd. EG
Revenue Intelligence Report • 29 quarters of SEC filing data • Updated 2026-03-15
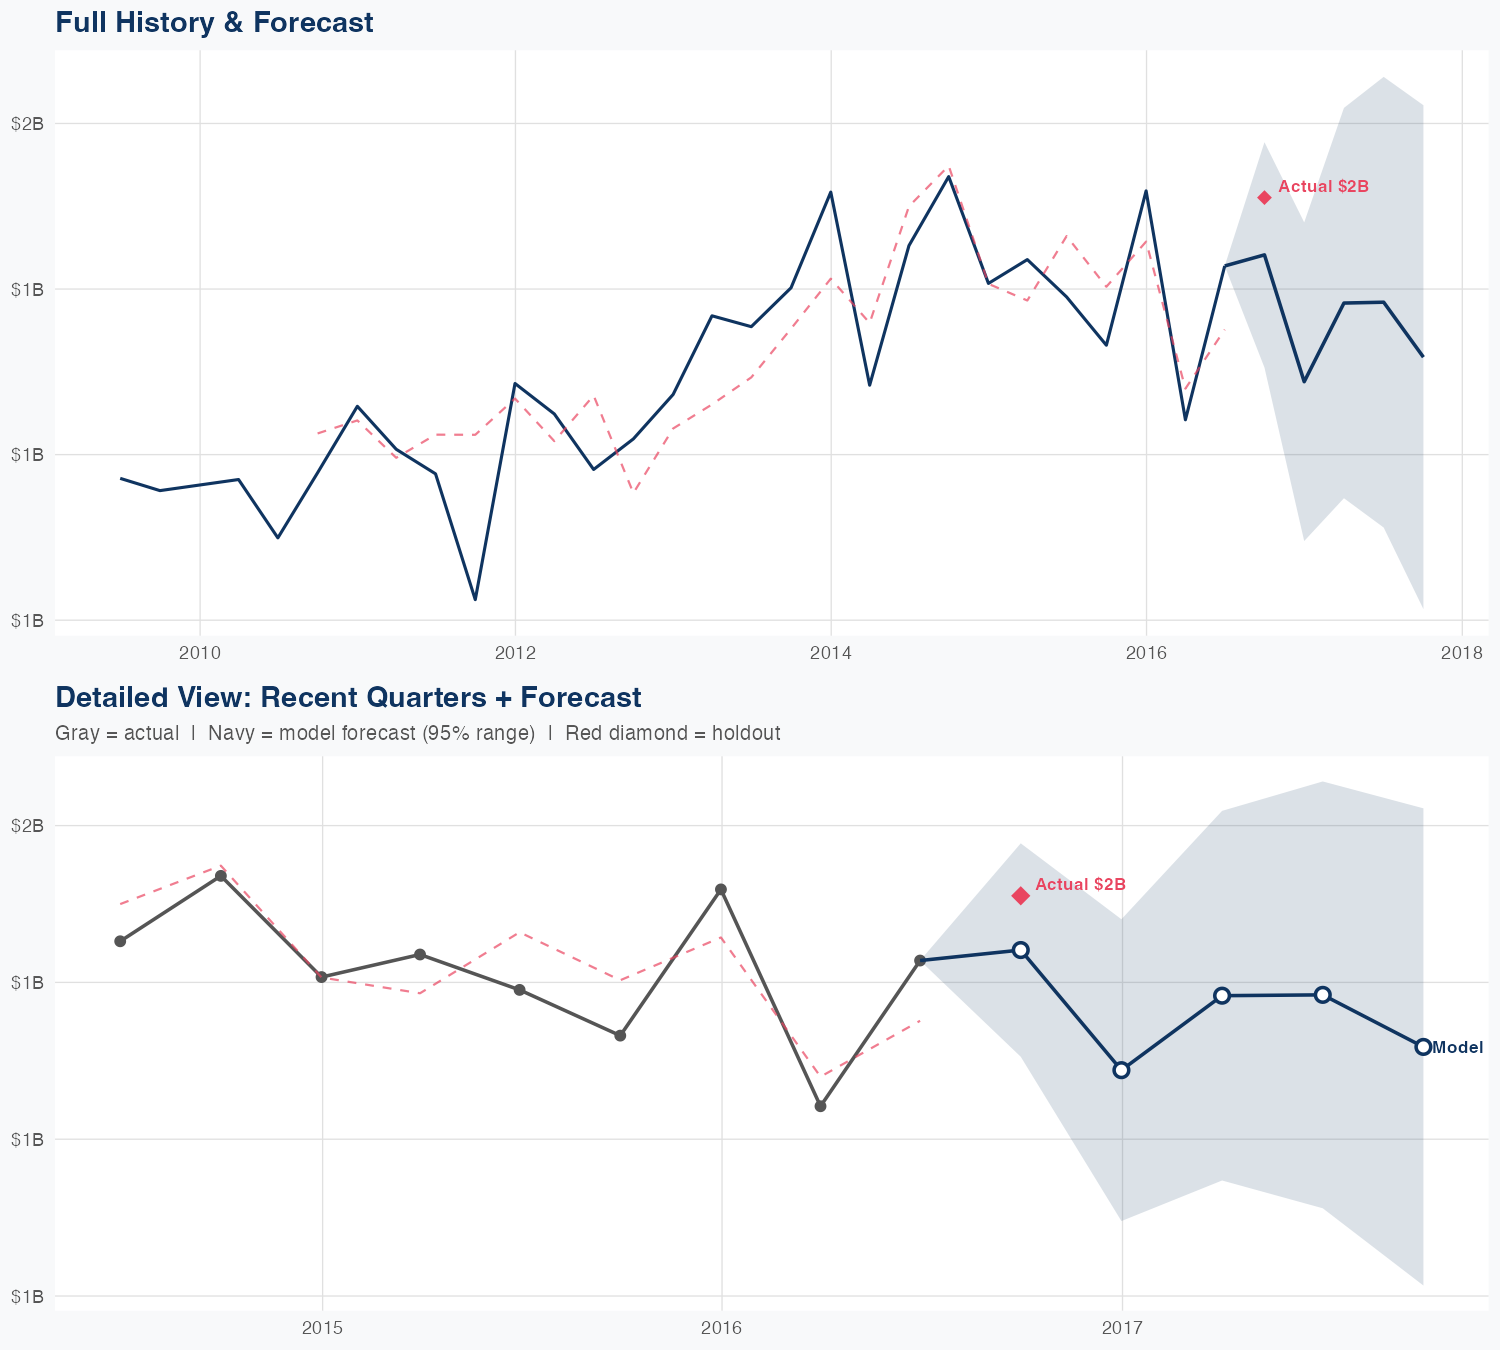
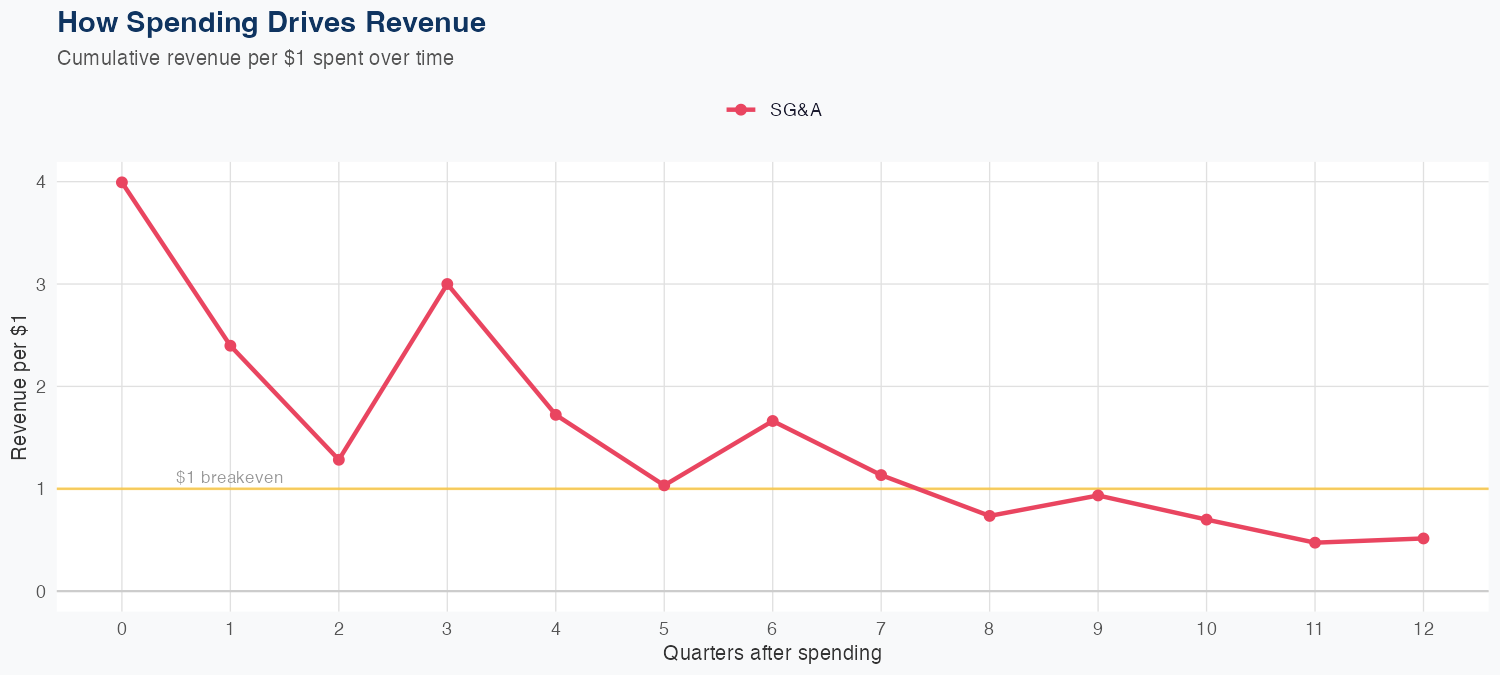
Revenue is anchored near $1.51B per quarter, with the primary driver identified as SG&A efficiency—about $0.51 of long-run revenue per $1 of SG&A—while R&D data is not available to gauge additional growth. The model is linear, trained on 29 quarters, with a 4.4% MAPE and a holdout test predicting $1.4B versus $1.5B actual (4.6% error), indicating reasonable forecast accuracy. The FY revenue forecast is $5.4B, down 5.7% year over year, signaling near-term revenue softness. Given the modest ROI on SG&A, upside hinges on improving efficiency or uncovering other revenue drivers.
Investment Thesis
The econometric model achieves strong accuracy (4.4% MAPE), suggesting Everest Group, Ltd.'s revenue trajectory is well-characterized by its spending patterns. Each $1 of SG&A spending generates $0.51 in revenue, reflecting strong commercial efficiency.
Revenue Forecast
Quarterly Detail
| Quarter | Model Forecast | Actual | 95% Range | YoY Growth | Status |
|---|---|---|---|---|---|
| Q3 2016 | $1.4B | $1.5B | $1.3B – $1.6B | +8.2% | ✓ In range |
| Q4 2016 | $1.3B | $1.1B – $1.5B | -15.2% | ||
| Q2 2017 | $1.4B | $1.1B – $1.6B | +11.4% | ||
| Q3 2017 | $1.4B | $1.1B – $1.7B | -3.1% | ||
| Q4 2017 | $1.3B | $1.0B – $1.6B | -12.8% |
Seasonal Factors
| Fiscal Quarter | Seasonal Factor | vs Trend | Interpretation | Obs. |
|---|---|---|---|---|
| FQ1 (Sep–Nov) | 0.9916 | -0.8% | In line with trend | 7 |
| FQ2 (Dec–Feb) | 1.0334 | +3.3% | +3.3% above trend | 6 |
| FQ3 (Mar–May) | 1.027 | +2.7% | In line with trend | 6 |
| FQ4 (Jun–Aug) | 0.9684 | -3.2% | -3.2% below trend | 6 |
How Spending Drives Revenue
Want this analysis for your portfolio?
I build custom revenue intelligence reports for investors and companies using SEC filing data, econometric modeling, and AI-powered insights.
Get in Touch