Factset Research Systems Inc. FDS
Revenue Intelligence Report • 60 quarters of SEC filing data • Updated 2026-03-15
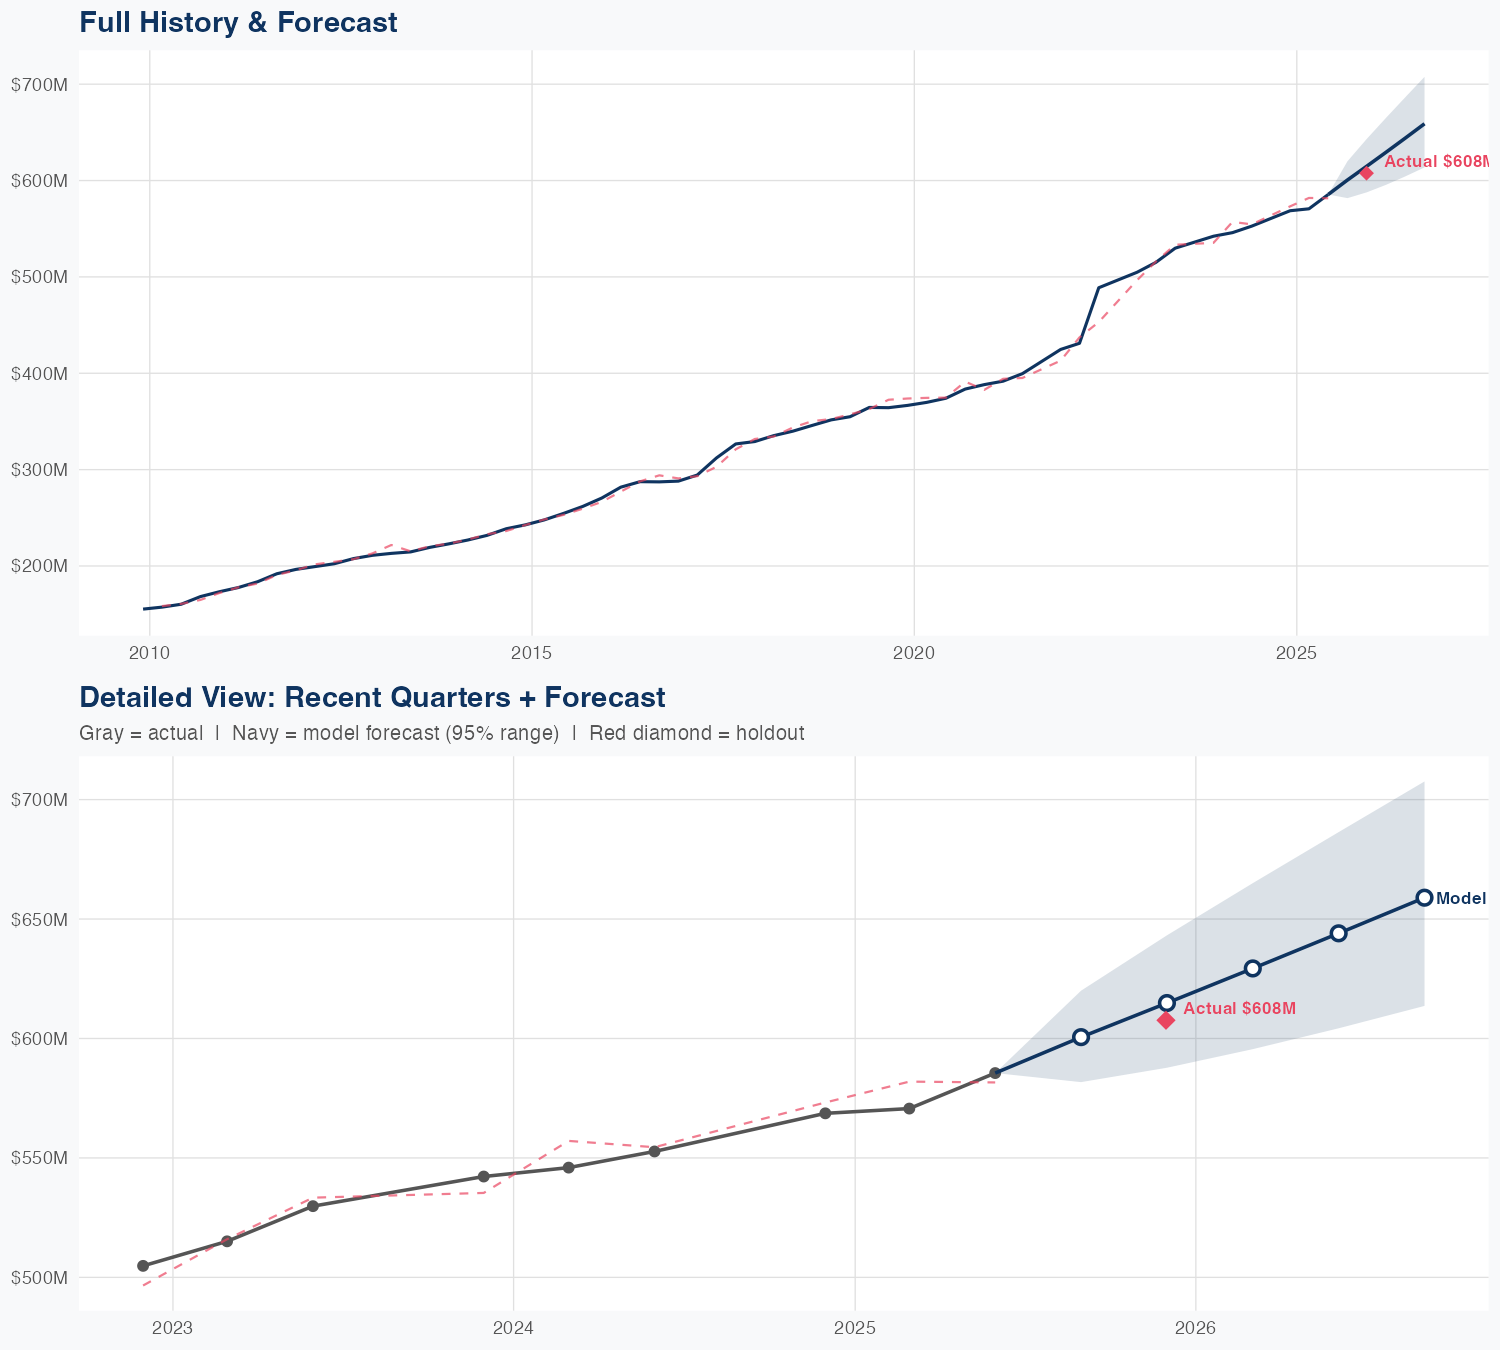
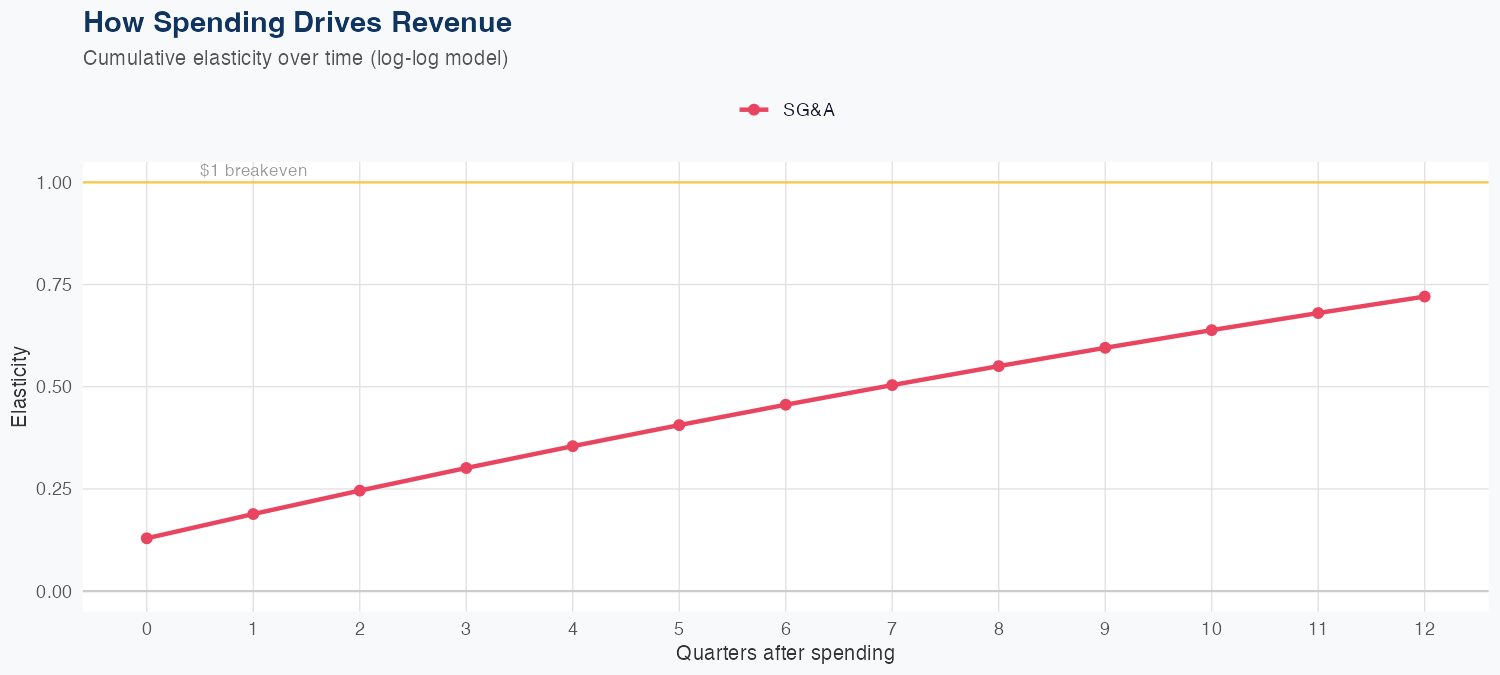
Revenue is driven by SG&A spending, with a log-log model showing elasticity of 0.72, meaning a 1% increase in SG&A is associated with a 0.72% rise in revenue. The approach demonstrates high predictive accuracy, with a MAPE of 1.1% and a holdout test error of 1.2% (predicted 601M vs actual 608M). The forecast for the full year calls for $2.547B in revenue, up 9.2% year over year, signaling solid top-line growth. ROI of SG&A spending is meaningful but sub-linear given the 0.72 elasticity, so investments should be evaluated on efficiency and margins; no R&D data is available to assess development ROI.
Investment Thesis
Our ARDL model tracks Factset Research Systems Inc.'s revenue with exceptional precision (1.1% MAPE), indicating highly predictable cash flows. Sales & marketing spend shows a 0.72x elasticity, suggesting effective go-to-market execution.
Revenue Forecast
Quarterly Detail
| Quarter | Model Forecast | Actual | 95% Range | YoY Growth | Status |
|---|---|---|---|---|---|
| Q3 2025 | $601B | $608B | $582B – $620B | +8.7% | ✓ In range |
| Q4 2025 | $615B | $588B – $643B | +8.1% | ||
| Q1 2026 | $629B | $596B – $665B | +10.3% | ||
| Q2 2026 | $644B | $604B – $686B | +10.0% | ||
| Q3 2026 | $659B | $614B – $708B | +8.4% |
Seasonal Factors
| Fiscal Quarter | Seasonal Factor | vs Trend | Interpretation | Obs. |
|---|---|---|---|---|
| FQ1 (Sep–Nov) | 1.0007 | +0.1% | In line with trend | 16 |
| FQ2 (Dec–Feb) | 0.9938 | -0.6% | In line with trend | 16 |
| FQ3 (Mar–May) | 0.9989 | -0.1% | In line with trend | 16 |
| FQ4 (Jun–Aug) | 1.0029 | +0.3% | In line with trend | 11 |
How Spending Drives Revenue
Want this analysis for your portfolio?
I build custom revenue intelligence reports for investors and companies using SEC filing data, econometric modeling, and AI-powered insights.
Get in Touch