Incyte Corporation INCY
Revenue Intelligence Report • 64 quarters of SEC filing data • Updated 2026-03-15
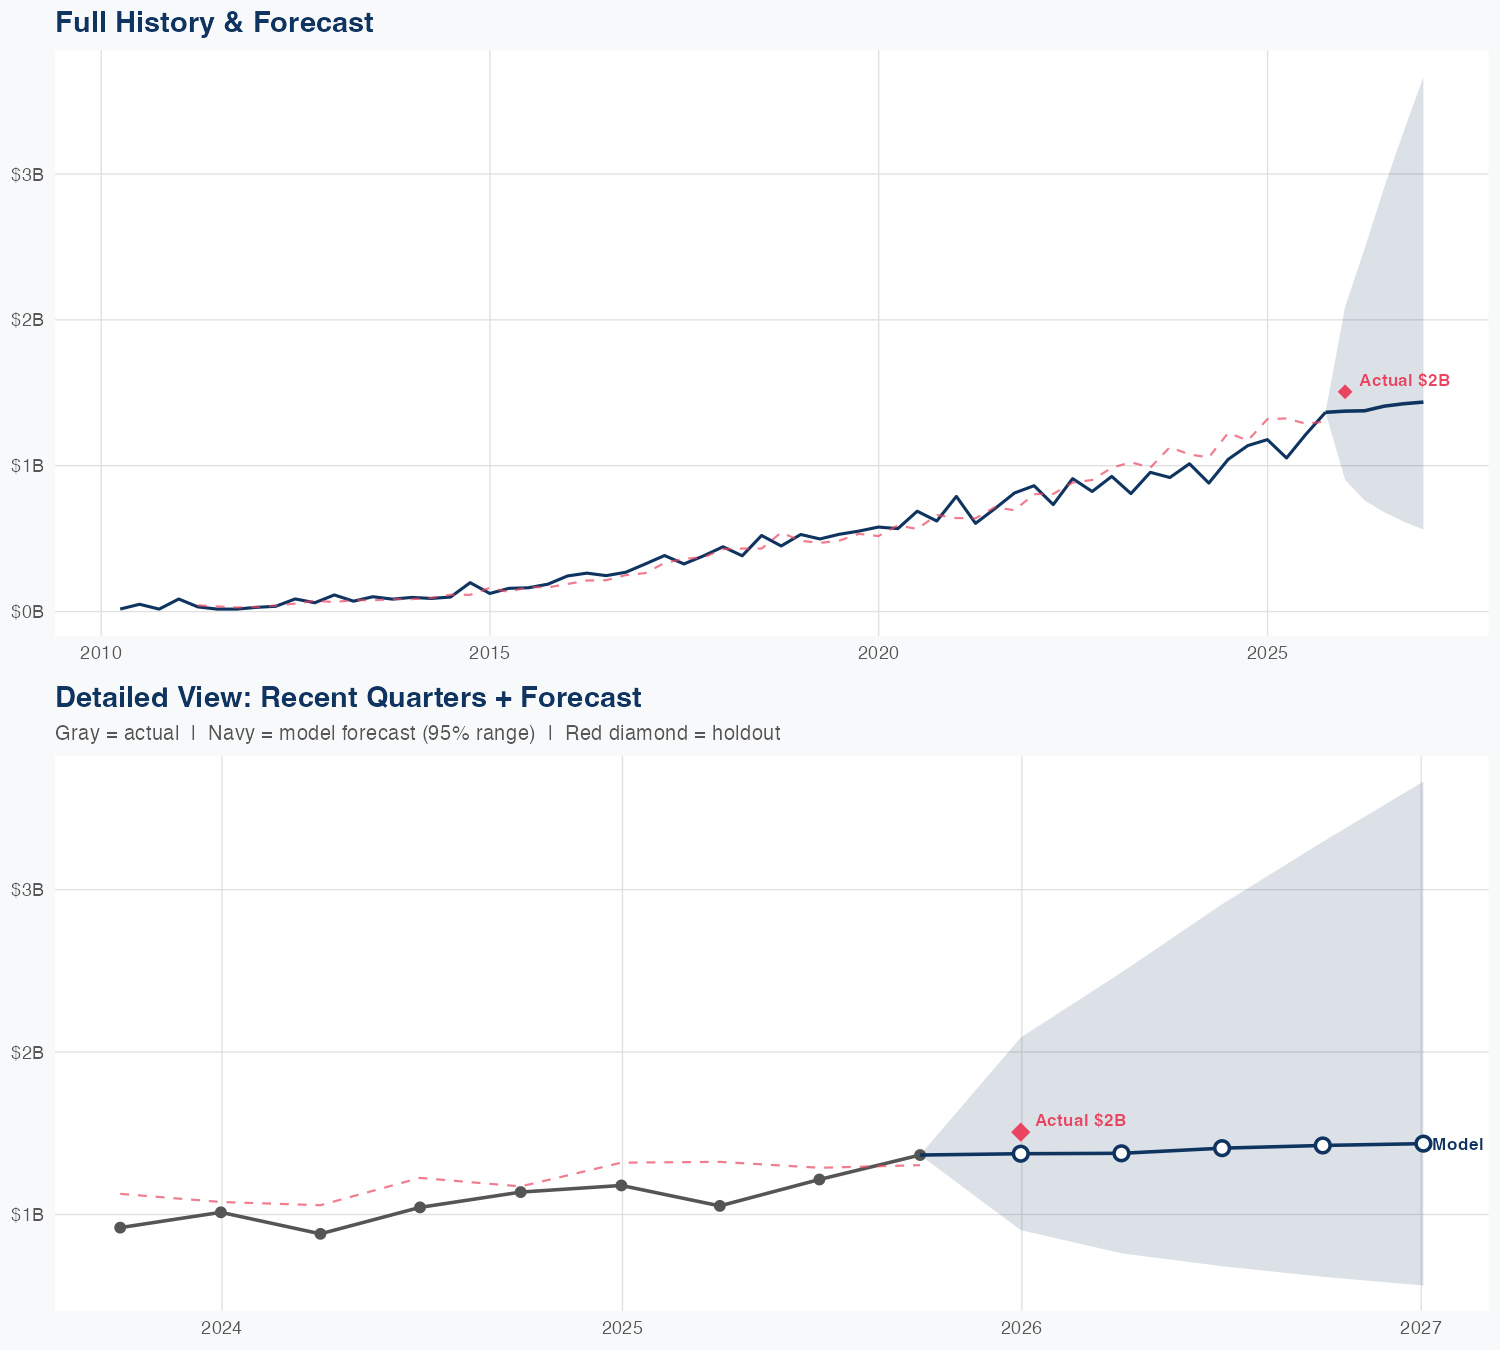
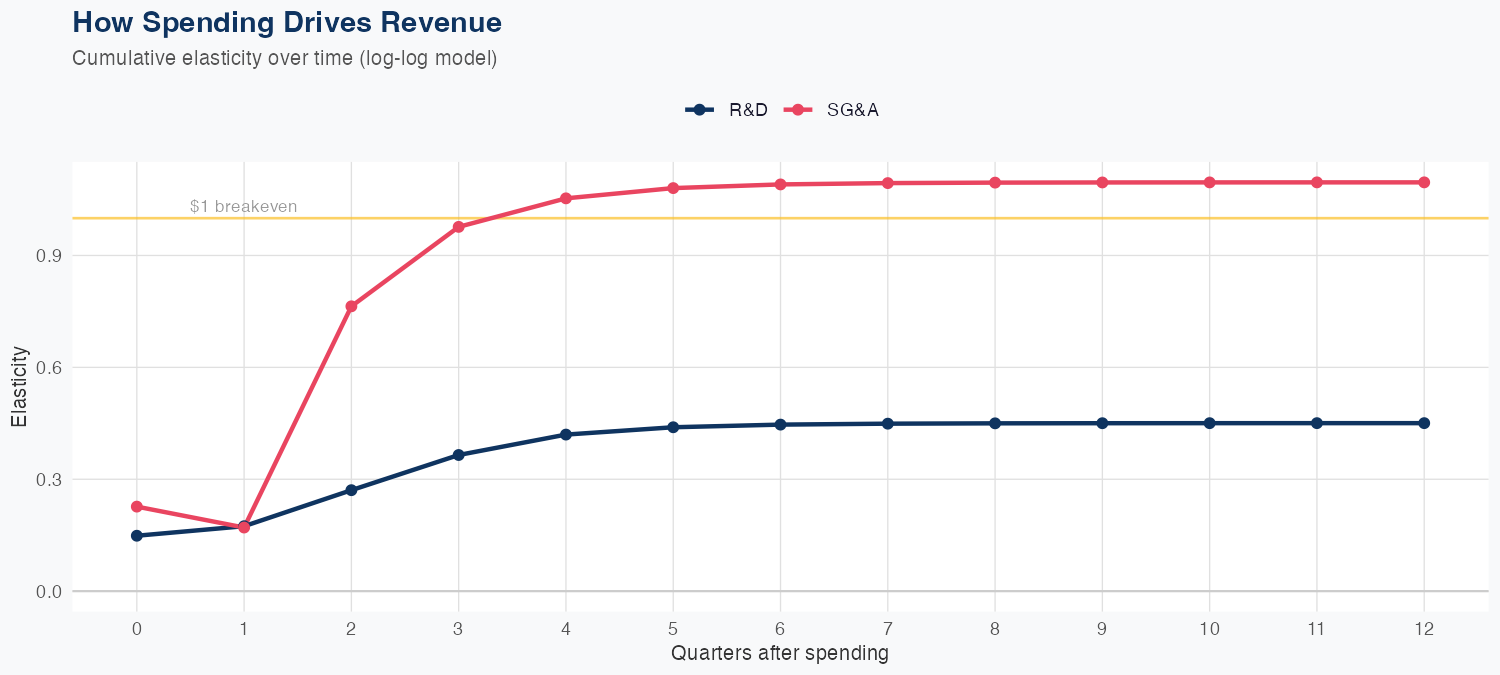
Revenue is driven more by SG&A spending than R&D, with elasticity estimates of 1.10% revenue per 1% SG&A increase and 0.45% per 1% R&D increase, indicating SG&A investments deliver the larger marginal lift. The model's holdout performance shows moderate predictive precision, predicting about 1.4B for the latest quarter versus 1.507B actual (8.8% error) and an overall MAPE of 16%. For Incyte, the latest quarterly revenue was about 1.51B and the full-year forecast calls for 5.6B, up roughly 9.8% year over year, suggesting continued top-line momentum. However, ROI interpretation relies on margins and costs not provided here; the growth outlook appears solid as SG&A continues to drive revenue while R&D remains secondary in elasticity, pending margin results.
Investment Thesis
At 16.0% MAPE, the model captures Incyte Corporation's broad revenue trajectory, though quarterly variability suggests sensitivity to external factors. R&D investment shows a 0.45x multiplier — each 1% increase in R&D spend is associated with a 0.45% revenue increase, signaling strong innovation-to-revenue conversion. Sales & marketing spend shows a 1.10x elasticity, suggesting effective go-to-market execution.
Revenue Forecast
Quarterly Detail
| Quarter | Model Forecast | Actual | 95% Range | YoY Growth | Status |
|---|---|---|---|---|---|
| Q4 2025 | $1.4B | $1.5B | $0.9B – $2.1B | +16.6% | ✓ In range |
| Q2 2026 | $1.4B | $0.8B – $2.5B | +30.7% | ||
| Q3 2026 | $1.4B | $0.7B – $2.9B | +15.9% | ||
| Q4 2026 | $1.4B | $0.6B – $3.3B | +4.3% | ||
| Q1 2027 | $1.4B | $0.6B – $3.7B | -4.7% |
Seasonal Factors
| Fiscal Quarter | Seasonal Factor | vs Trend | Interpretation | Obs. |
|---|---|---|---|---|
| FQ1 (Sep–Nov) | 0.9944 | -0.6% | In line with trend | 15 |
| FQ2 (Dec–Feb) | 1.072 | +7.2% | +7.2% above trend | 15 |
| FQ3 (Mar–May) | 0.9089 | -9.1% | -9.1% below trend | 15 |
| FQ4 (Jun–Aug) | 0.9859 | -1.4% | In line with trend | 15 |
How Spending Drives Revenue
Want this analysis for your portfolio?
I build custom revenue intelligence reports for investors and companies using SEC filing data, econometric modeling, and AI-powered insights.
Get in Touch