Lowes Companies Inc LOW
Revenue Intelligence Report • 69 quarters of SEC filing data • Updated 2026-03-15
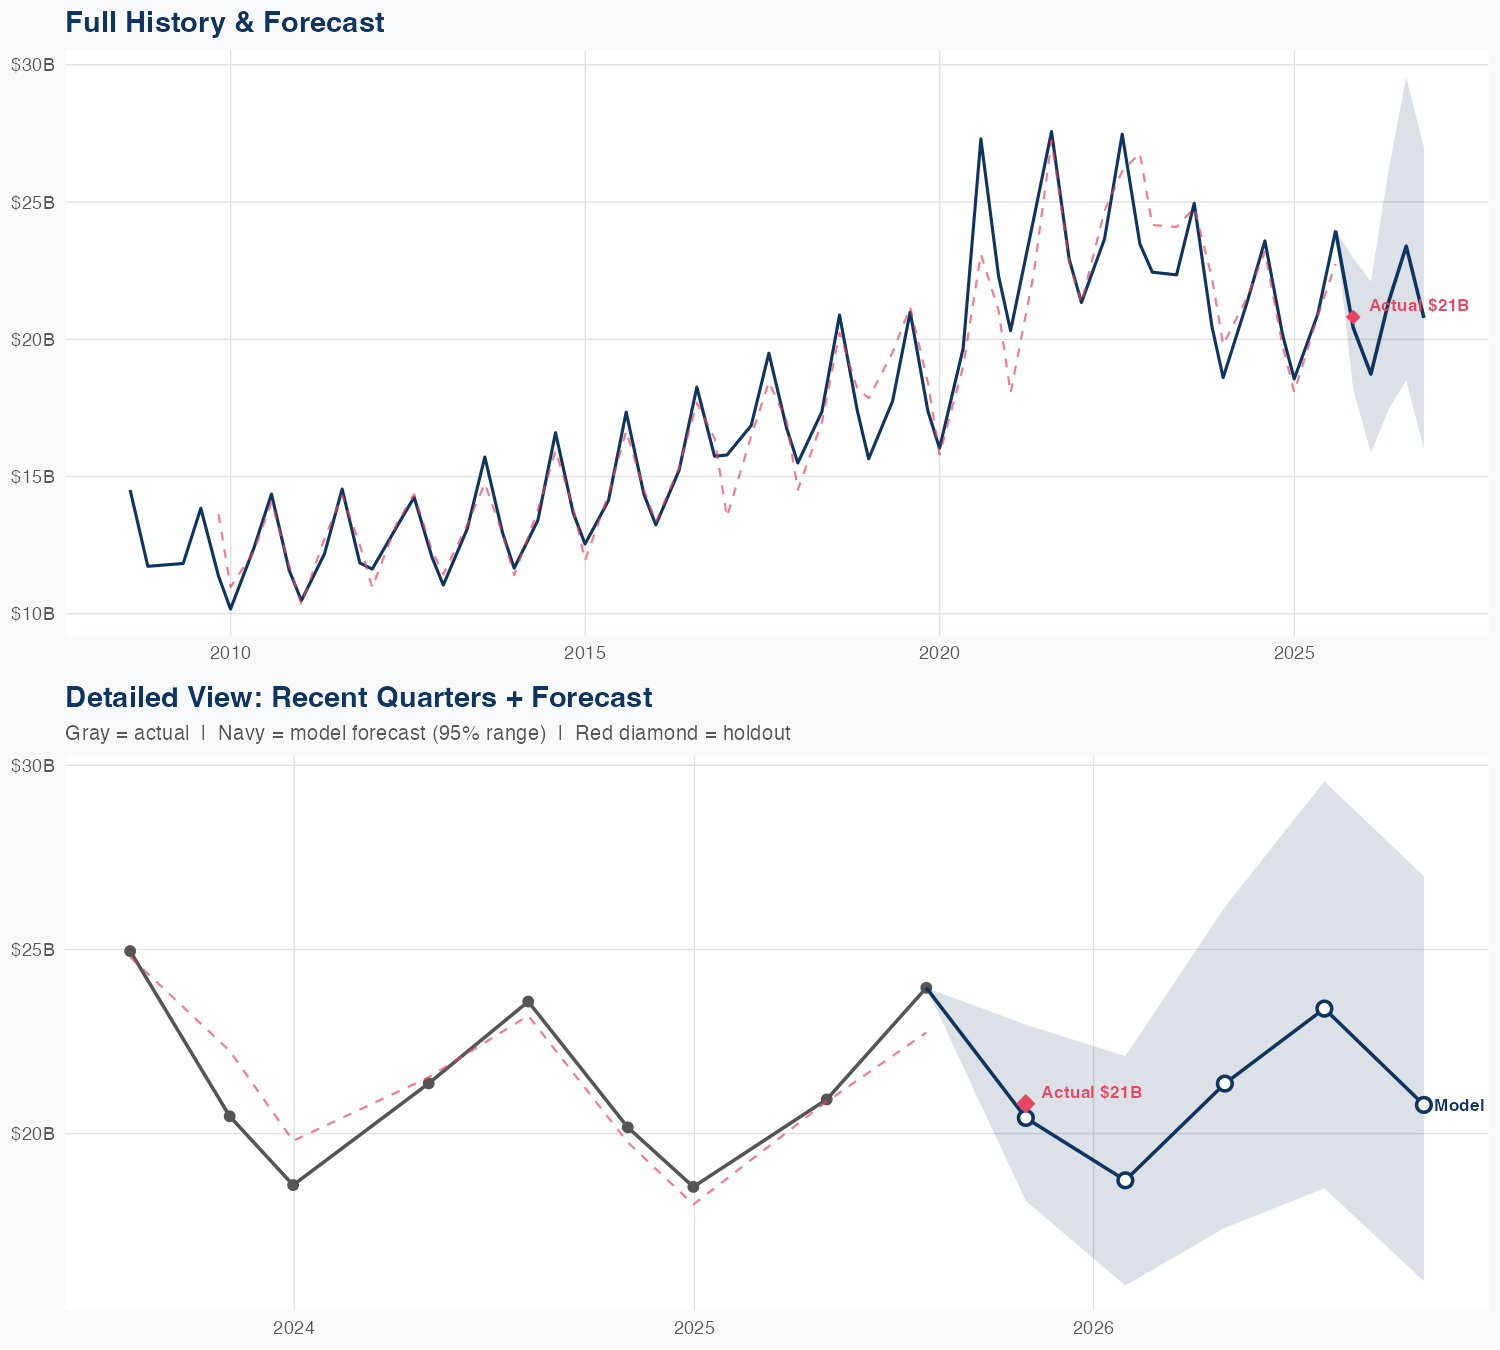
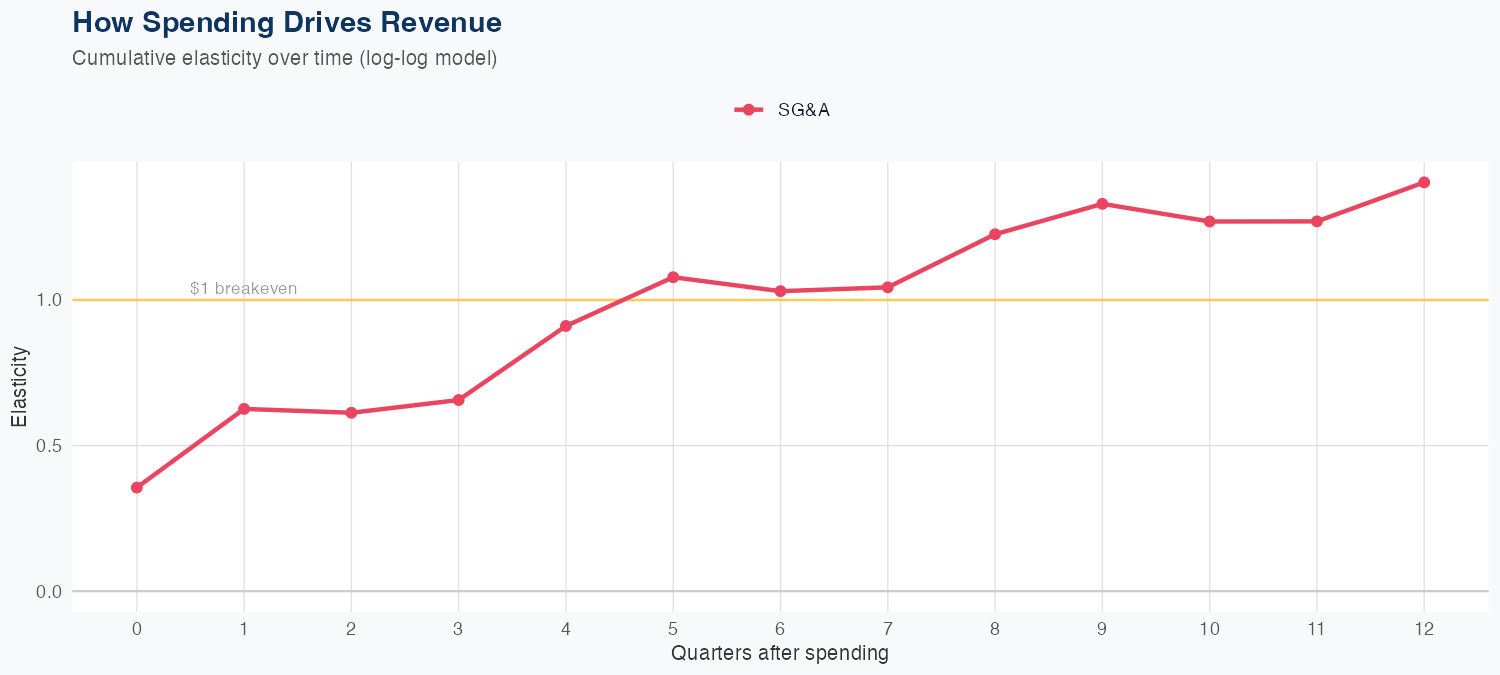
Revenue growth appears to be driven primarily by SG&A spending, with a 1% increase in SG&A linked to a 1.40% rise in revenue in this log-log framework; R&D data is not available to attribute any lift to R&D. The model shows solid predictive performance, with a 4.3% MAPE and a holdout error of 1.9% (actual $21.0B vs predicted $20.0B), supporting reliability for near-term forecasts. The FY forecast implies about $84B in revenue, essentially flat year over year, signaling limited top-line growth despite the SG&A-driven upside potential. For investors, SG&A appears to be a revenue lever with potential ROI if spending is efficiently targeted; however, the absence of other growth drivers and a modest outlook suggest the near-term catalysts for meaningful revenue expansion are limited.
Investment Thesis
The econometric model achieves strong accuracy (4.3% MAPE), suggesting Lowes Companies Inc's revenue trajectory is well-characterized by its spending patterns. Sales & marketing spend shows a 1.40x elasticity, suggesting effective go-to-market execution.
Revenue Forecast
Quarterly Detail
| Quarter | Model Forecast | Actual | 95% Range | YoY Growth | Status |
|---|---|---|---|---|---|
| Q4 2025 | $20B | $21B | $18B – $23B | +1.3% | ✓ In range |
| Q1 2026 | $19B | $16B – $22B | +1.0% | ||
| Q2 2026 | $21B | $17B – $26B | +2.0% | ||
| Q3 2026 | $23B | $19B – $30B | -2.4% | ||
| Q4 2026 | $21B | $16B – $27B | -0.2% |
Seasonal Factors
| Fiscal Quarter | Seasonal Factor | vs Trend | Interpretation | Obs. |
|---|---|---|---|---|
| FQ1 (Sep–Nov) | 0.9851 | -1.5% | In line with trend | 17 |
| FQ2 (Dec–Feb) | 1.0146 | +1.5% | In line with trend | 16 |
| FQ3 (Mar–May) | 0.9922 | -0.8% | In line with trend | 16 |
| FQ4 (Jun–Aug) | 1.0326 | +3.3% | +3.3% above trend | 16 |
How Spending Drives Revenue
Want this analysis for your portfolio?
I build custom revenue intelligence reports for investors and companies using SEC filing data, econometric modeling, and AI-powered insights.
Get in Touch